December 14, 2012 by Sean Childers in Analysis with 17 comments
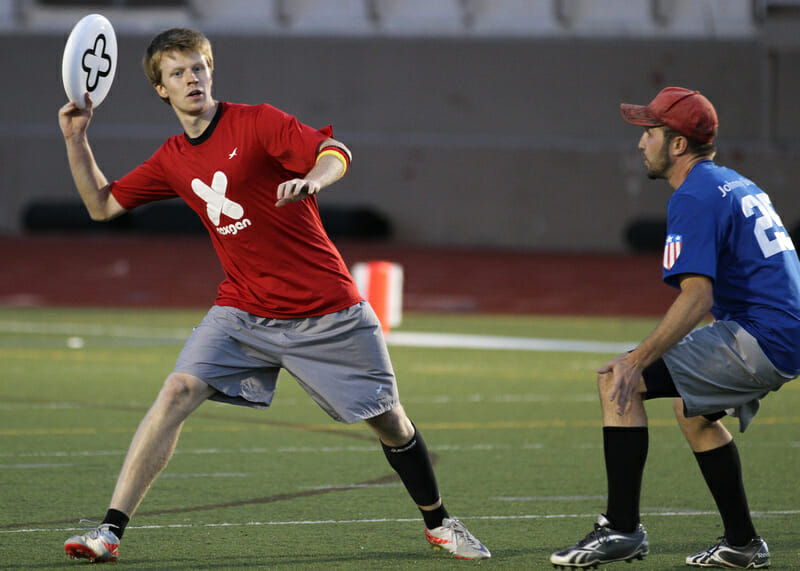
 This is the first article in a new series on player and team statistics from the NexGen tour. Read more in Ultiworld’s first statistical project, The Statistics Of NexGen. Photo courtesy of William ‘Brody’ Brotman for Ultiphotos. Check out more photos from the 2012 NexGen Tour.
Team sports, including Ultimate, widely vary in the degree to which there are clearly defined positions, perhaps best thought of as athletic and technical specialization. Football is the American sport is at one extreme of specialization: quarterbacks throw and linemen block (and often are ineligible to even receive a pass). We don’t expect to see a quarterback in a lineman’s body or a lineman with a quarterback’s arm.
In Ultimate, however, position is a much more nebulously defined concept. Every competitive player is expected to be able to throw, catch, cut, and defend, at least to some degree. At highly competitive levels of play, a player’s with fewer offensive skills may get less of a DLine role, and another player may lose OLine playing time simply because her defense is too suspect after a turnover. In Ultimate, being a well-rounded player is essential to being a good one. Basketball and soccer are relatively similar in this regard, though arguably more specialized than Ultimate; in our sport, there is less physical segmentation than in basketball and more positional freedom than in soccer.
All of this is to say that the concepts of “handlers”, “cutters”, “defenders”, and especially “mid-cutter” or “center handler” are difficult to precisely define both statistically and theoretically. Determining the statistical relationships between positions and identifying measurements of interest are not straightforward tasks for the community. For example, should handlers have more turnovers than cutters, because they touch the disc more? Well, probably – and they should still normally be touching the disc more! But should they have more turnovers-per-attempt (a lower completion percentage)? Maybe not.
Furthermore, given the multiple-hats that any player will find herself wearing during the course of a tournament – completing three throws on one point, getting a layout D on the next, and dropping a pass in a third – there is a question we shouldn’t ignore: do positions really exist in Ultimate as much as we sometimes think they do?
Of course, the 2012 NexGen team may be an outlier in this regard — to the extent that they have 15 players capable of doing everything, they may not need positions as much as the average team. But this also makes them an ideal test for proving the existence of positional attributes. If these outstanding players, skilled enough to do it all, have measurable differences across positional metrics, then there is good reason to buy into some degree of a positional specialization framework in ultimate.
The answer we’ve found is pretty resounding. Using a few simple statistical tests, you can pretty easily see separation between handlers and cutters.
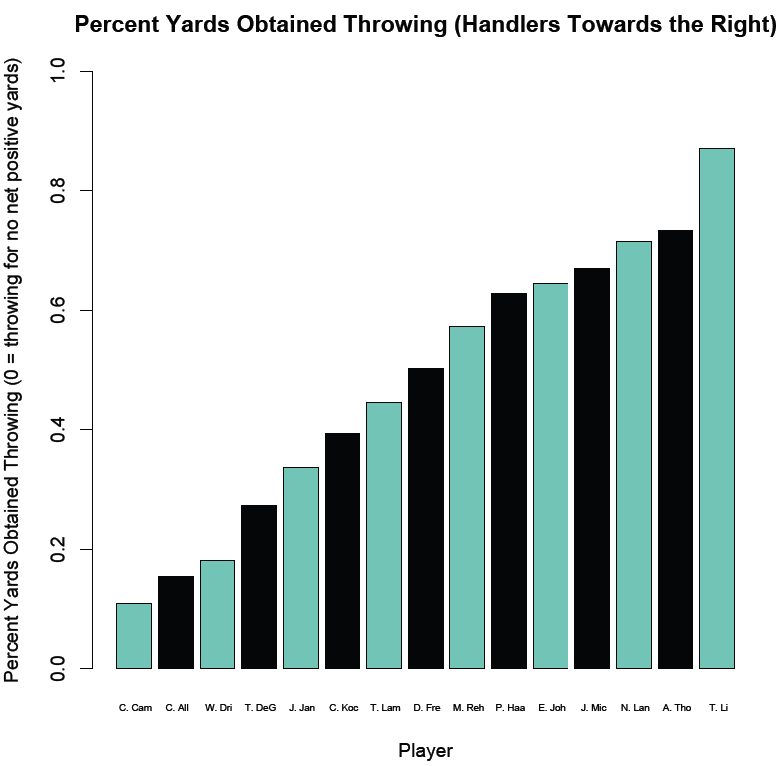
The above graph is the result of our program assigning every yard that each player was “involved” in after asking whether the player was “involved” in obtaining those yards either as the thrower or the receiver.1 So, if a player throws more often than they receive, they are likely to be towards the right. However, what makes this graph a bit different is that it looks more to quality or substance of the involvement, (by measuring the yards) rather than the mere quantity (by counting the number of throws).
This is also important because almost every catch in Ultimate is followed by a throw. A quick illustration: two handlers doing a give-go counts for the same amount of throws and catches for each player as a handler throwing a huck and then getting the disc back a yard away from the deep receiver. But while those look similar in terms of receptions and throws, it wouldn’t look similar in our graph above. To be 100% clear, the emphasis on yards means you move a lot on this graph depending on whether you are the person throwing or catching a long huck; little reset throws, on the other hand, barely nudge you in either direction.
The amount of distribution and variance on this graph is staggering. Far on the left are three players (Colin Camp, Camden Allison-Hall, and Will Driscoll) who obtain more than 80% of their yards from catching discs. On the far right is one player (Tommy Li) who is just as specialized, but as a thrower.
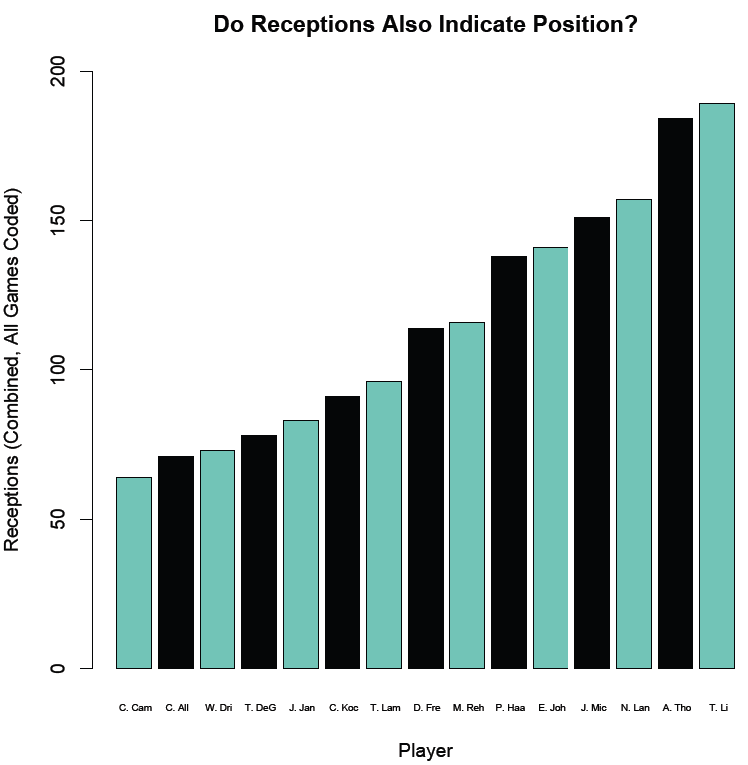
As a quick comparison to the “yardage” view, below is a graph that just counts the number of receptions each player had.
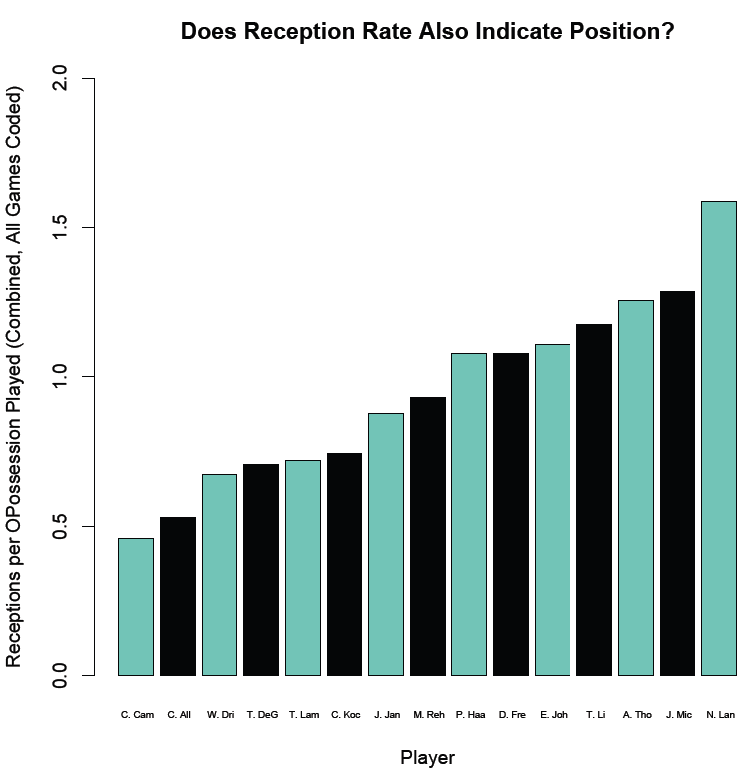
Clearly there is a lot of correlation and similarity between the number of receptions and the number of receptions per offensive possession played; in general, there is more similarity between absolute numbers and rates on a team like 2012 NexGen, where players play relatively equal playing time.2
But the three graphs together give us an interesting picture of player position. I ranked each player according to how far left he was for each graph (a rank of 1 meant they were the furthest left in a graph and suggestive of cutting; a rank of 15 meant they were furthest right and suggestive of handling). While this oversimplifies by not really appreciating the quantity of the difference between players, it does give a rough idea of who the pure handlers and pure cutters are.
| Player | Average Rank |
|---|---|
| PURE CUTTERS | |
| Colin Camp | 1 |
| Camden Allison-Hall | 2 |
| Will Driscoll | 3.33 |
| PURE HANDLERS | |
| Tommy Li | 12.67 |
| Alex Thorne | 13.33 |
| Jimmy Mickle | 13.33 |
| Nick Lance | 14.33 |
| THE HYBRIDS | |
| Chris Kocher | 5 |
| Tyler DeGirolamo | 5.33 |
| Tommy Lamar | 5.67 |
| Jacob Janin | 7 |
| Matt Rehder | 8 |
| Eric Johnson | 9.33 |
| Phillip Haas | 9.67 |
| Dylan Freechild | 10 |
The tough conceptual move is knowing what to think about the players in the middle. We need to compare at least two competing theories of players in the middle of the pack: are these players that really play more fluid and middle-like positions than the guys at the extremes, or are these players who just switch back and forth between handling and cutting on various points?
The first theory suggests a positional view of ultimate where some players really sit backfield (pure handlers), other players really focus on downfield and wait for their chance to do deeper receptions (pure deeps), and a third category of players do something in between. To clarify, I don’t mean here that the difference is non-continuous: any attempt like the one above to draw a line in the sand at an arbitrary rank of 4 or 11 is clearly arbitrary. But the existence of a continuum certainly doesn’t negate the ends, and it probably doesn’t negate the middle, either.
As an analogy, in basketball, the existence of combo guards, combo wings, or undersized centers doesn’t negate the existence of point guards, small forwards, or centers. And a big question that this table presents is whether there really is a position that is something like the middle: the LeBron James or Shawn Marion wing who we ask to do a bit of it all.
On the other hand, the second theory accords with a dichotomous picture of positioning, adhering to what we might hear in a line call: “You three handle in the horizontal stack, and you four cut.” Over the course of the NexGen tour, various players had to drop back to handle some, too. This theory explains the middle by saying guys like Johnson, Haas, and Freechild just dropped back a bit less than the four main handlers, but also quite a bit more than anyone else.
In time, we should be able to learn how applicable this is to other teams. Currently, we only have twelve games of data for 15 players for one all-star team. Personally, I can’t wait to see whether other teams employ such sharp deviation, with some players throwing for almost 90% of their involvement yards and others less than 15%.
More data will make this really exciting. Concluding that handlers exist may not seem profound, but getting Ultimate onto paper is an incremental process. Ultiworld plans to use these concepts on our player statistical pages to predict player and position types from players whom we’ve never seen personally.
Using the data alone, we will predict each player’s position and include that evaluation on each player’s page. That, in turn, allows for more interesting comparisons and evaluations like, “His turnover rate is especially low, given that he handlers,” or, “She attempts a lot of hucks for a pure cutter.”
Finally, this exercise is necessary statistically to the extent that separating handlers and cutters is typically not going to be our goal, so we need to be careful and ensure that our analysis is doing more. One of our other articles in this series takes a look at goal line involvement and shows a pretty strong handler/cutter separation. That suggests that it’s not the best metric for player quality since it adheres too closely to mere position classification. And it also suggests that we should be thinking about the players who are outliers: when we get a metric that tracks close to the positional divide but find a few players deviating, we might have just found something interesting to say about those players.
The deepest debt is owed to Ian Guerin, whose countless hours of work developed the program. It would also not have been possible without immense help from Wesley Cronk and Kahyee Fong, who coded the games. Jeremy Weiss also offered thoughtful discussion and comments on early drafts of the piece and project. And big thanks to NexGen for making such great videos!


