When we talk, think, and strategize about Ultimate, defensive skill sometimes takes a back seat to offensive play. But we have begun to search for new ways to quantify good defense. Here we introduce one of those: the Ultiworld D rating.
July 1, 2013 by Sean Childers and Kahyee Fong in Analysis with 28 comments

When we talk, think, and strategize about Ultimate, defensive skill sometimes takes a back seat to offensive play. We know our stars and Callahan winners for those moments when the disc is in their hands. Hours are spent discussing the virtues of horizontal, vertical, and split stack offenses –- more than is spent talking about backhand or forehand forces, or man vs. zone defense. And stat keepers usually track three variables of offensive interest – goals, assists, turnovers – but only track one on defense: blocks.
Part of the problem is that it’s really hard to measure good defense. Is it good defense to bait a layout block or to stop your man from touching the disc? Is it better to front and deny your man at the risk of getting beat deep?
We have begun to search for new ways to quantify good defense and our goal is to improve defensive measurement in the long term. Using the UltiApps tracking system, we designed four new defensive metrics that we plan to employ during our coverage of the US Open.
Our current view is that there is no single measurement or statistic that perfectly estimates a player’s defensive value. Intuitively, different players may employ different defensive styles to help their team. And some teams may rely on help schemes or momentary zones rather than one-on-one man coverage. But combining multiple metrics and statistics yields an interesting picture of a player’s defensive style and overall strength as a defender – a picture we are currently calling our “Ultiworld D Rating.”
Like last year, we have been tracking statistics from each of the NexGen games — here’s an early look at the top defenders on the team, according to our ‘D Rating.’
| Player | Ultiworld D Rating |
|---|---|
| Aaron Neal | 1.95 |
| Tim Morrissy | 1.61 |
| Simon Montague | 0.94 |
| Dylan Freechild | 0.86 |
| Aaron Honn | 0.86 |
| Jacob Janin | 0.55 |
| Eli Kerns | 0.43 |
| Elliot Erickson | 0.10 |
| Camden Allison-Hall | -0.19 |
| Jimmy Mickle | -0.61 |
| Chris Kocher | -0.81 |
| Jay Clark | -0.82 |
| Mitch Cihon | -0.83 |
| Trent Dillon | -1.19 |
| Will Driscoll | -2.85 |
Metric 1: Good Defense Is Denying Scores
The offense’s job is to score, so good defenders should prevent scores. Our statistics track the closest man defender on each pass, including scores. The closest defender on a catch for a score acquires a “goal against.” The goals against number is then adjusted to account for number of defensive possessions played; otherwise OLine players would have fewer goals against simply because they played less defense.
The NexGen 2013 data is notable for who is so far not stopping goals: NexGen Veteran Will Driscoll. Driscoll has repeatedly been beat deep and given up 12 goals. But Driscoll’s case shows the volatility of this statistic, especially in a small sample: Each score hurts a player a lot, making it subject to a lot of noise. In contrast, Driscoll gave up relatively few goals in our 2012 NexGen stats. Through four games1, Aaron Honn, Simon Montague, and Aaron Neal have been the toughest defenders to score on, though a larger sample size of data would give a fuller and less noisy picture.
Metric 2: Good Defenders Pick Their Spots, Giving Up Less Dangerous Options
One important finding of our 2012 NexGen series was that yardage matters as both an indicator of offensive impact and because scoring is easiest when you only have a few yards to go. And touches (or disusage, discussed below) matters in terms of yards: Giving up only one touch isn’t very useful if it is a reception for a 70 yard score. Finally, calculating the yardage against each player minimizes some of the ‘goals against’ bias. A player who gave up the 50 yard pass to the eventual assister is hurt on this yardage metric more than the guy who gave up the three yard upline cut to the scorer.
If there’s one player on NexGen 2013 that is athletic and smart enough to embrace this metric and limit his matchup’s positive yardage, it may be Simon Montague. In the below clip, Montague first poaches off his man, tries to make a play, and then quickly recovers –only giving up a few positive yards to his man despite the aggressiveness. The second clip shows his handler defense pushing the opposition backwards. He triangulates the dump’s upline cut and even flashes into other throwers’ upfield throwing lanes.
[youtube iEU9ewgIBhs 600 377]
Metric 3: Good Defense Is Denying Your Man The Disc
Emphasizing “hand in pocket” defense and not allowing your man to touch the disc (rather than focusing on blocks) is an emerging trend. This piece doesn’t dwell too much on whether such defense is possible at the elite level or whether it’s even advisable to play so aggressively. But the NexGen data is interesting in that regard: NexGen 2013 shows more variance in offensive usage than in defensive “disusage”, which is the term and statistic we use to describe how often your man touches the disc (compared to the total number of opponent touches while you were on the field). In other words, the other elite club teams have been able to get touches on just about everyone.
Metric 4: Good Defenders Get Blocks And Get Us The Disc
Finally, we also track the number of blocks and interceptions each player generates. We adjust the number to account for the number of defensive possessions played. A player with two D’s in a point when his team was on defense three times has .66 D’s per defensive possession.
So What’s the Best Metric? Normalizing and Combining
My personal favorite defense is shutdown, disc-denying, yardage-preventing coverage. I tend to think that my blocks usually only follow prior defensive mistakes.
So imagine my surprise when, after tracking my college team’s data all season, we found that our best-regarded defenders were almost always the ones with the most blocks per defensive possession played. While that line of thinking is subject to bias, it’s also important to always evaluate new statistics in light of what you already know about players.
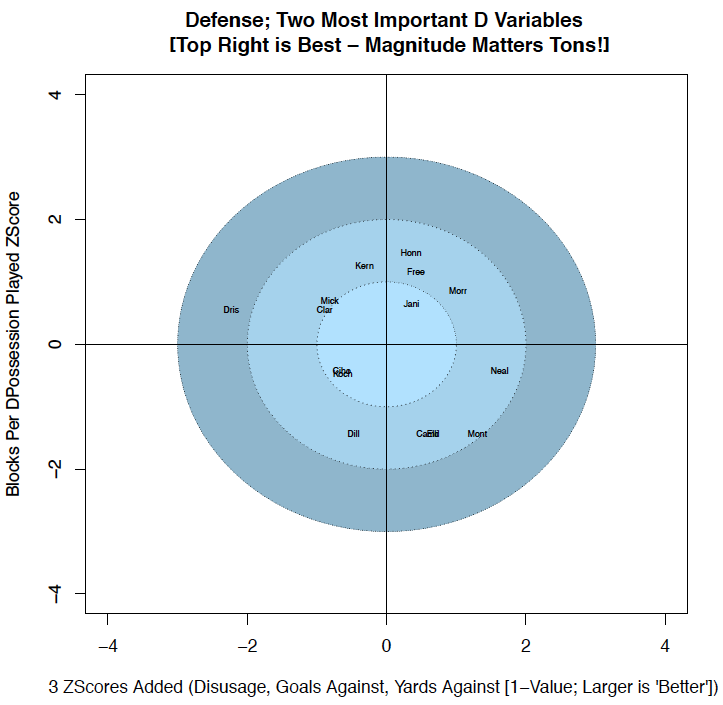
But blocks isn’t quite everything. Our favorite interpretation of individual defense, the Ultiworld D Rating, averages the three other defensive metrics (goals against, defensive disusage, and ratable share of yards against) and places it alongside blocks per possession.2 Essentially we are suggesting that each of those statistics has about one-third of the explanatory value as playing-time-adjusted blocks. Finally, all of the metrics are scaled so that higher values are always better and team means and deviations are calculated: The values in our graphs are measurements of standard deviations (ZScores), not raw values.3
Your stud NexGen defenders (Aaron Honn, Dylan Freechild, Tim Morrissy, and Jacob Janin) are in the top right: These are guys that get good amounts of blocks but also do a better-than-average job in the other areas (diusage, yardage against, and goals against). Your worst defenders are in the bottom left, and, again, magnitude matters: Driscoll’s lone placement in -2 land reflects that he is giving up tons of huck yardage for goals against, and a decent amount of touches, too.
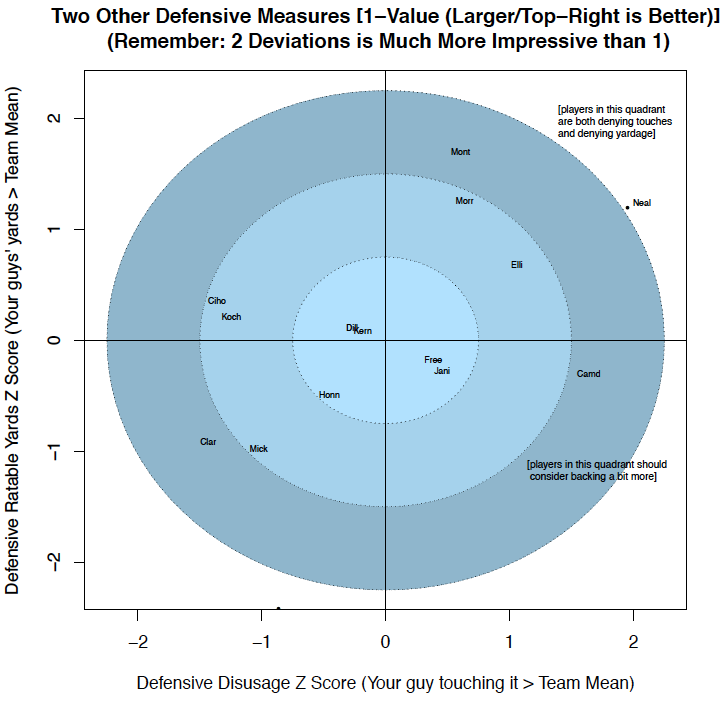
Another representation is the relationship between yardage against and disusage. Guys who give up lots of yards on a few touches should maybe consider backing more. Guys who give up few yards on a lot of touches could think about trying to reduce the amount of touches even at the expense of taking a risk; maybe fronting is in order. This graph shows that relationship:
Interestingly enough, NexGen 2013 didn’t show many signs of obvious coaching improvements — fewer players are far off in the top left or bottom right quadrant than we see in typical college team data. These guys know what they’re doing on defense.
Crunching the defensive numbers on NexGen 2013 after just four games is a bit of a fool’s errand. A great all-around player, Driscoll’s numbers are guaranteed to improve some while Montague will regress back towards the team mean. Our late-season NexGen defense article will be more decisive in support and critique of individual players. Nothing we do will ever be able to capture all the intricacies of help defense, flashing in the lane, marking, or even zone coverage. But we wanted to share our first small step in defensive quantification with the Ultimate community, introduce the metrics before our US Open coverage begins, and get our readers’ feedback.
Thanks to Husayn Carneige, Jeremy Weiss, Ian Guerin, and the UltiApps teams for their help in the project. Visit Ultiapps.com to download the stat tracking client on your mobile device.
***
Due to early NexGen streaming issues, our project is missing some data from the Revolver and Doublewide game. ↩
In the long-term, we can regress each of these variables to defensive plus-minus scores. But this will take much more data than what we currently have. ↩
The technical notes on that. Three metrics are inverted (subtract the raw value from 1) so that higher scores are always better for each number. And each player’s score is actually a reflection of its comparison to the team mean in each metric – this reduces our ability to compare players across teams, but minimizes other statistical issues. The important point is that magnitude becomes very important: A score of 2 on any metric is much better than 1, and a score of 3 is basically off the charts. Formally, zscores were calculated, which tell you how many standard deviations above or below the team mean the player was. ↩

