Four-three or not four-three, that was my question.
June 25, 2018 by Guest Author in Analysis with 0 comments
This article was written by Kathy Frantz, an ultimate player and student at UNC Asheville.
There has been plenty of discussion, even today, about USA Ultimate’s proposed gender ratio changes for the Mixed Division in late 2016. However, most arguments — both for and against — were based on personal experience or were entirely theoretical. As a mixed ultimate player, I was determined to find a data-driven model to provide some objective insight on policy reform. This past spring, in collaboration with the math department at UNC Asheville, I completed an undergraduate research project to do just that.
My study began as an analysis of gender-based policies in mixed ultimate. Per the current 11th edition rulebook, there aren’t many of these policies other than the roster limit and the gender ratio. All teams competing in the club division have a roster cap of 27 players. In the mixed division specifically, the gender ratio during game play is 4:3 — either four men (4M:3W) or four women (4W:3M).
EARLIER: Statistics Show Female Players Underrepresented In Elite Mixed Ultimate
However, the current roster limit doesn’t directly impact how “mixed” a team is. In theory, a team can roster 27 men and still compete in the mixed division. This extreme might seem ridiculous as they could still only field three or four players at a time, but the current mixed division does heavily favor men. The average elite mixed team fields 15 men and 11 women, and I’d expect regional and sectional level teams to have even fewer women. By this number alone, teams are already skewed to play with a 4M:3W ratio. And since 4M:3W is typically the default ratio in the Division, I thought it might actually be detrimental for a team to deviate from this. Taking it one step further, I asked the question: do women even have a substantially different role playing with four women on the field?
With this in mind, I set out to find any relationship between roster, gender ratio, and a team’s success.
The Study
Using the 16 teams at Club Nationals from 2014-2017, I took each roster and broke it down by gender. Then I recorded the results for all pool play and bracket play games. I excluded placement games altogether from the study because, from personal experience, I find their outcome can be heavily influenced by flight times or margarita bars.
Once I had all roster data and game results, I then watched all recorded games available from the data set used. Between Ultiworld and ESPN archives, there were 18 games total with 22 out of 64 teams represented. From these games, I took my own stats including male and female touches, defensive plays, turnovers, and hucks. Finally, I broke down a few of these select subcategories comparing points played 4M:3W against points played 4W:3M.
The Results
Roster
A typical team had a 42% female and 58% male roster composition. Looking at all teams and their rank, there was slight negative correlation between roster composition and tournament finish, though not enough to be statistically significant. That is to say, teams that had more women on their roster had a slight tendency to place lower in the tournament overall.
When looking at individual games, there was seemingly no relationship between roster composition and the likelihood to win a given game. Though there are far too many variables that could contribute to the outcome of any game, I was still curious about this and the above trend: I ran one last test, this time only looking at the final and semifinal games where teams are arguably the most closely matched. Doing so yielded a much stronger correlation value of -0.5, suggesting that, in these games, the team with more women is moderately more likely to lose the game and by a wider margin.
Touches
For in-game stats, I primarily focused on touches. The touch statistic isn’t perfect, but I still believe it to be one of the best representations of a player’s contribution on the field. I defined a touch to be any time a player picks up or catches a disc, including all attempted touches. For example, a rescinded catch after a travel call or a dropped pass were both still included as touches for that gender.
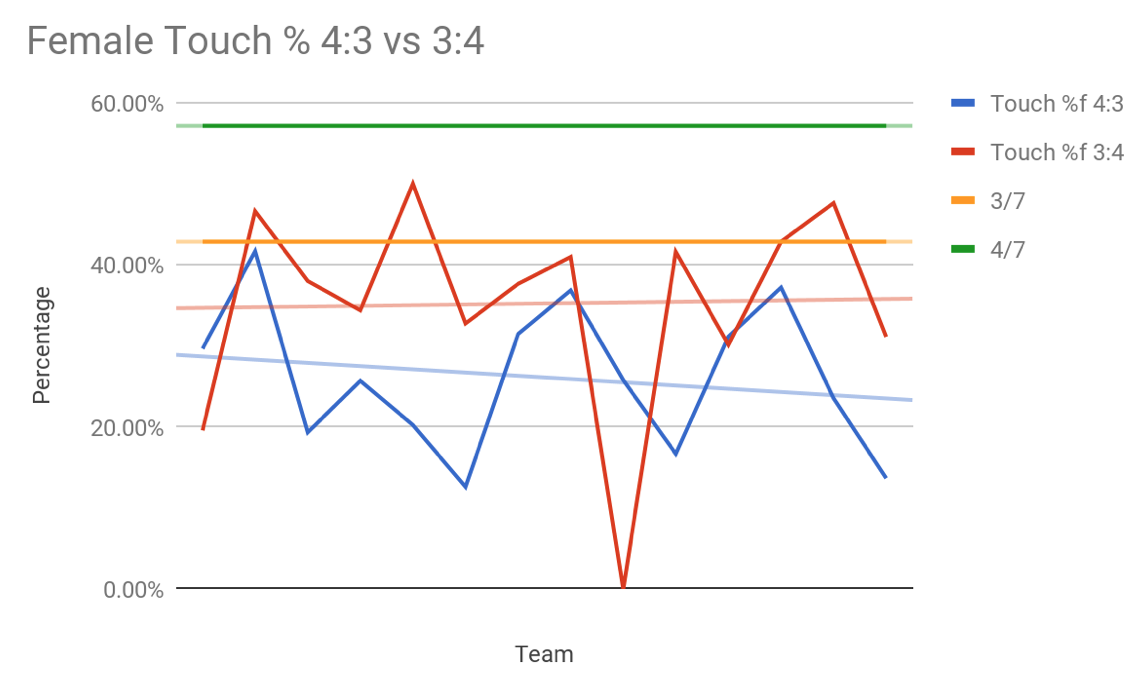
Overall, men had roughly 74% of their team’s touches, while women had only 26%. Assuming an equal distribution of touches (calculated from each gender’s playing time given all 4M:3W and 4W:3M points used in this study), that number should have been 55% for men and 45% for women. The lowest female touch percentage was just over 12% (Metro North 2016) and the highest was nearly 46% (AMP 2017). A breakdown by individual teams can be found below.
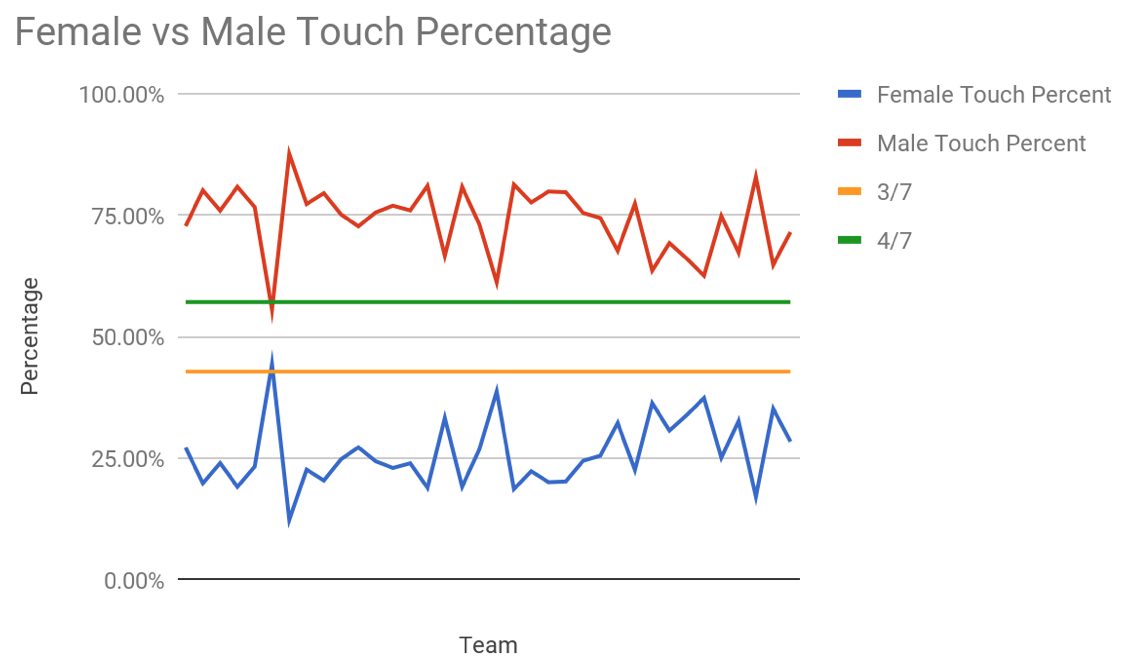
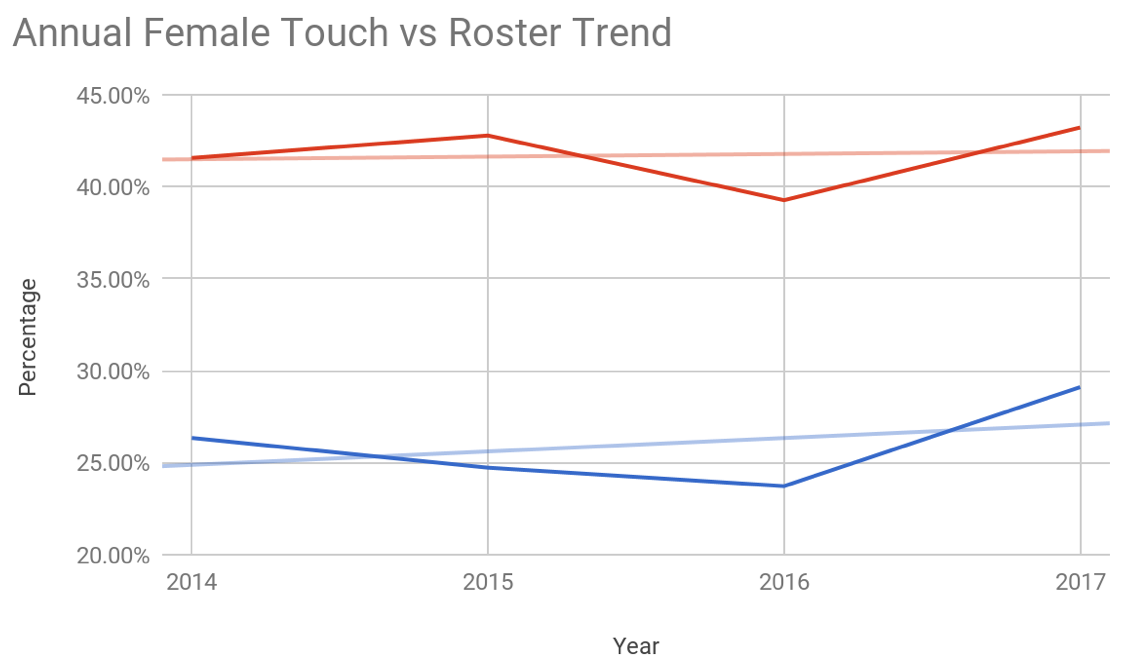
I then compared these touch percentages to roster percentages. On an individual team basis, teams that had more rostered women typically also had higher female touch percentages. I was worried this trend might be skewed due to the variability of any individual game, but this trend was strongly apparent annually too, with a correlation of 0.69. In 2017, when average female roster percentages were at their highest at 43%, female touch percentages were also at their highest at 29%.
Furthermore, I broke down touch percentages by winning and losing team. The winning team had an average female touch percentage of 24.7% while the losing team had a percentage of 27.7%. Given that the average female touch percentage is 26.2%, this makes for about an 11% difference between the winning and losing team. Though not a very concrete statistic, this might be supportive of the earlier hypothesis that having more women might be detrimental to your team.
I compared touches to turnover rates as well. Men had an average ratio of 14 touches per turnover, while women had a slightly worse ratio at 11.25 touches/turn.
Lastly, I created one last touch category to count who picks up a stopped disc, like after a turnover or by catching the pull. Men picked up a stopped disc 93% of the time. In games that choose to play 4W:3M, men pick up the disc only slightly less often: 84%.
Defense
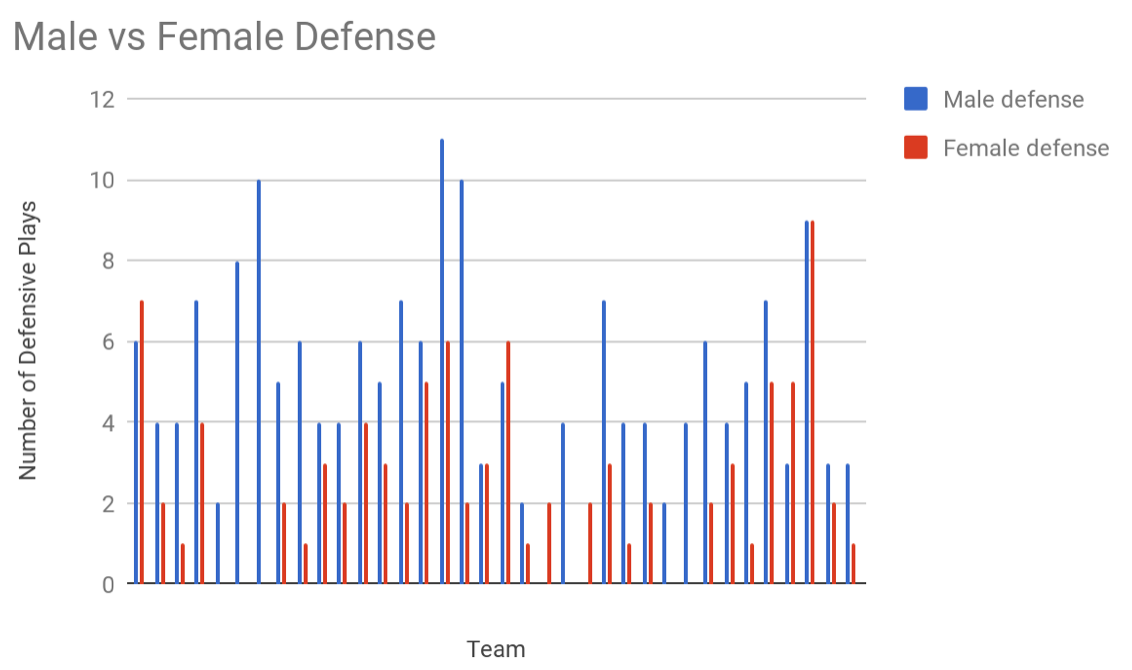
One theory I often hear proposed is that women will have less of an offensive impact because teams tend to roster women to fill primarily defensive roles. By the numbers, men made 66% of defensive plays while women made around 34%.
However, these percentages represent total defensive plays and could be skewed because women are less involved offensively and so have fewer chances to play defense. If this were a defense-to-touch ratio, women average 18.4 touches per defensive play while men average a much worse ratio of 26.7 touches per defensive play.
Hucks
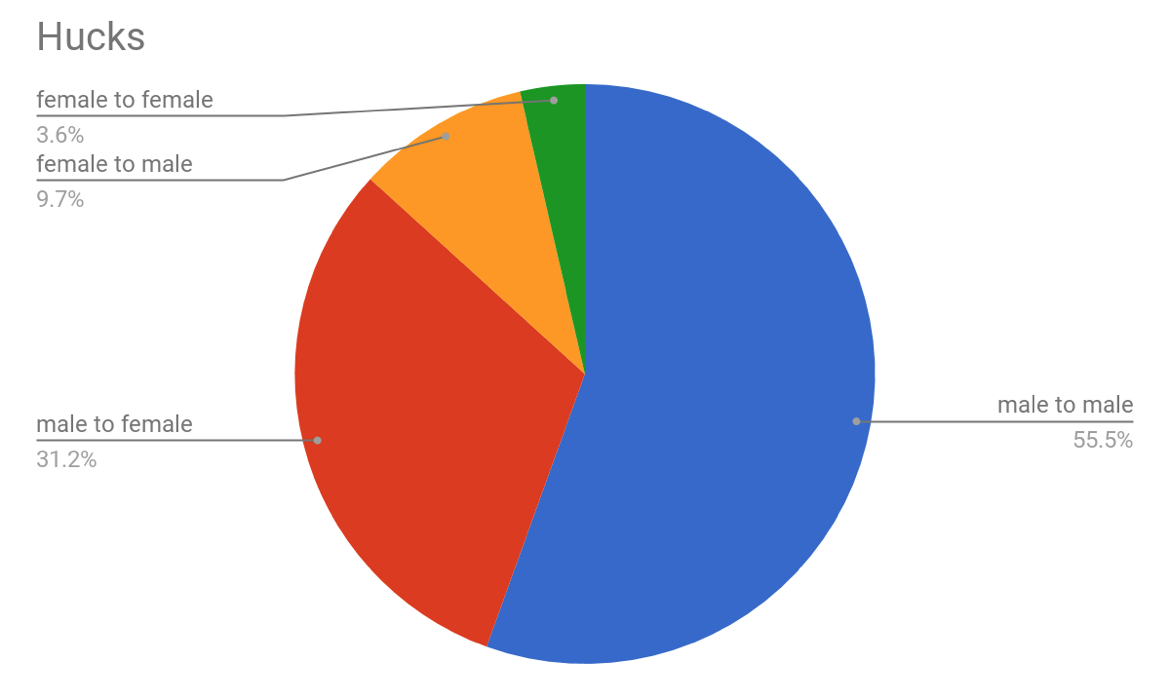
Similar to the defense argument, I’ve heard many theories on the offensive role women should have. Since women typically can’t throw as far as men, it’s suggested they might instead catch more hucks downfield. However, about 65% of hucks are thrown to men and only 35% to women.
Note: I’ve frequently heard that players choose not to huck to women out of fear of a male poaching off for a block. I don’t have data to either support or deny this claim, but, from an observational standpoint, I saw this happen fewer than five times total out of all 18 games observed.
Gender Ratio
Lastly, I broke down what data I had by points played 4M:3W against 4W:3M. Unfortunately, there were only seven games out of 18 that had at least one 4W:3M point, so the data in this section is extremely limited. Most often, there would be one team in a game who chose to play 4W:3M, and often only when they were losing.
Playing 4W:3M does increase female touch percentage, but only from 26% to 35%. Assuming equal touches based on playing time, this number should go from 42% to 58%. This is roughly the same proportion of female touches regardless of playing 4M or 4W.
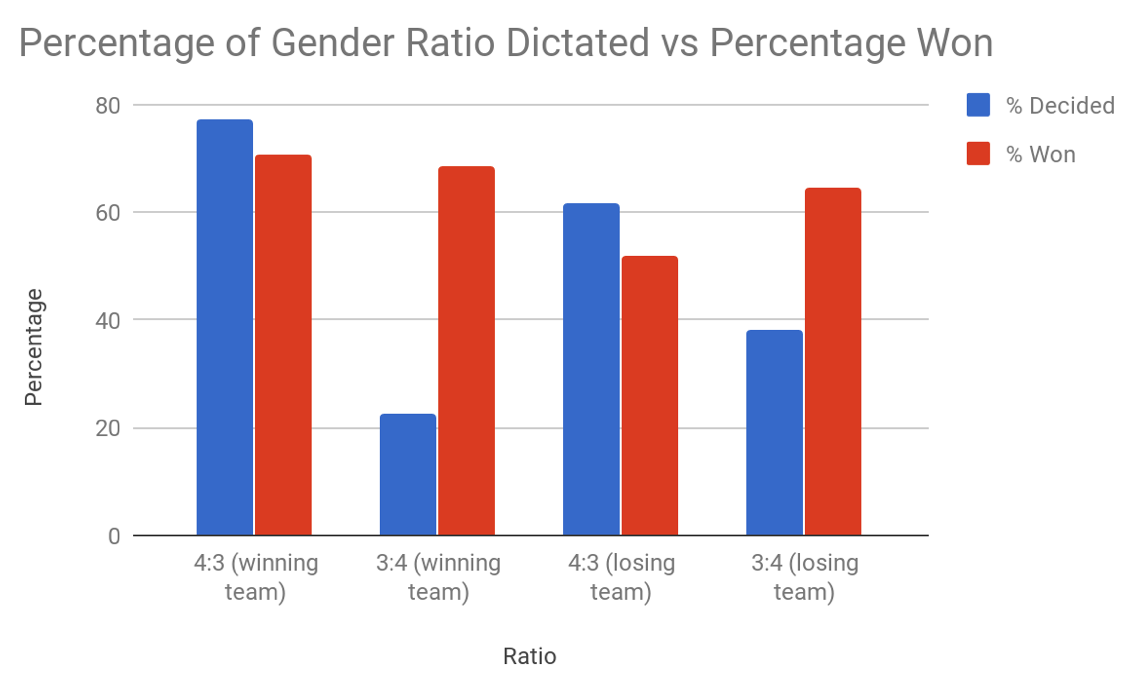
The last thing I looked at was the relationship between the team that dictates the gender ratio and whether or not they win the point. Overall, the team that decides to play 4W:3M typically loses the game, suggesting playing with four women is only used when strategically necessary. However, the losing team typically wins more points played with four women than points played with four men, while the win rate is roughly the same for the winning team.
Analysis
I have three main takeaways from these results. Overall, there is significant lack of parity between male and female players in every statistic. This is most noticeable in touches and hucks, where it’s apparent men have a much more dominant role offensively. Men also make more defensive plays overall, but they have a lower defense to offense ratio. This might support the traditional notion that women have more of a defensive role than an offensive one.
Not only are women underrepresented in play, but there’s no substantial difference in their contributions when playing 4M vs. 4W. In particular, women average roughly 20% fewer touches than men in both game settings. This might suggest that in-game play is not in fact determined by gender ratio but is more prominently affected by other variables.
Finally, having more women represented on a roster consistently leads to increased female involvement. Teams with a higher female roster percentage choose to play 4W more often, and they have a higher female touch percentage in both ratios. In all fields where roster percentage is considered against game play, there’s strong correlation between a higher female roster percentage leading to higher female participation in game play.
Conclusion
I think the data stands on its own, so I’ll let people draw their own conclusions, but I do have one last point to make here.
The “end zone dictates” rule did increase the use of 4W. However, it seems too passive to truly account for the disparity between the number of points played 4W versus 4M. And even still, playing 4W didn’t even come close to equalizing female participation on the field either, suggesting the problem might lie elsewhere.
The primary distinction between male and female players lies in the composition of the roster: it’s clear that having more rostered women does increase female involvement. Additionally, teams that roster more women are more likely to play 4W more often. Adjusting the current roster policy may be the most effective way to create a more equitable mixed division.
By reducing the current roster limit to 26 players and limiting each gender to 13 players each, teams may more readily choose to play an equal amount of 4M and 4W points. However, there’s still no rule demanding an equal number of male or female players nor a given gender ratio. So a team is free to only roster 11 women, but they won’t have the option to fill the remaining spots with men. This way teams still retain autonomy over their rosters, but might naturally move to a more equitable distribution.
Appendix
Data
The touch statistic may raise some qualms due to the notion that handlers get more touches, particularly on teams with one primary handler who is almost always going to be male. I did expect touch stats to be somewhat skewed because of this, but not to the extent that women are only touching the disc half as much as expected. While watching these games, I noticed that male cutters were almost always the first to initiate, and, in general, they were simply more active on the field. On the other hand, women had a tendency to throw to other women more often. This may have been a matter of positioning, but if a throw went to a female downfield, typically the next two to five passes would also be to women.
All data used can be found in this spreadsheet. Some tabs get a little messy, especially when I needed to reorganize the data to make the graphs, but the values highlighted in pink are the key points of each tab.
You can also read my paper if technical writing is your thing. Or, if you’d like a more concise section view of the data, you can check out my presentation. Bonus: it can also be used to lecture your friends on the importance of the gender equity movement!
Acknowledgments
I couldn’t put this research together overnight, and I certainly couldn’t put it together on my own. First and foremost, thank you to my advisor, Dr. Sam Kaplan, for working with me on this.
This study is dedicated to Cate Foster Yackey for showing me what it means to believe in a team, for teaching me how to play mixed ultimate, and for being the first person to tell me it’s ok to care too much.
I’d also like to give a special shoutout to Ryan Bell for being a major ally in my time with Asheville Ultimate Club, and for letting me throw emails at him throughout the course of this project.
And, last but not least, thanks to Kyle Silva for coming up with a really cool title for my research (among other good ideas too).