Are we seeing evidence of a throwing bias against female players in the Mixed Division?
July 24, 2018 by Guest Author in Analysis with 0 comments
This article was written by Tom McClintock, an ultimate player and astronomer currently relocating from Arizona to New York. It is a response to the recently published Ultiworld article titled Research: Elite Mixed Ultimate Still Skewed Towards Male Involvement.
Ultimate is a game of possession, similar to American football or European soccer. Players all contribute to the goal of moving the disc downfield while employing a variety of strategies and tactics. Similar to those other sports, a key statistic one can use to evaluate an individual’s contribution is usage rate or, more colloquially, “touches” of the disc.
Recently, Kathy Frantz, an undergraduate researcher from UNC Asheville, took on the monumental task of logging all touches, or the number of times a player touched the disc, over 18 games during Mixed Nationals between the years 2014 and 2017. As we all know, ultimate is unique among team sports in that there exists a highly competitive mixed division with both genders represented on the field at the same time (sorry, Quidditch, you don’t count). Frantz’s analysis sought to parse the data to identify trends in usage rates between genders across all teams, and one statistic immediately jumped out: “men had roughly 74% of their team’s touches, while women had only 26%.” Those percentages become 71% and 29%, respectively, if we discount players picking up a dead disc, as discussed by Frantz in this Reddit comment.
This raises a question: what is the source of this obvious disparity in usage rates? As Frantz discusses, even if teams played all points with a four men to three women ratio (4M:3W), one would expect men to receive 57% of touches to 43% for women (i.e. 4/7 and 3/7 ratios). As has been discussed thoroughly in the comments of Frantz’s article, these usage rates are clearly affected by positional assignments on the field — any mixed player routinely plays on lines with two male handlers and one female handler.
In other words, we find ourselves asking a new question: can throwing patterns that depend only on player positions account for the disparity in usage rates between men and women, or did Frantz observe an actual throwing gender bias at Mixed Nationals? To attempt to answer this question, we can turn to simulations to assemble usage rates given general, realistic throwing patterns among mixed players. The following section details the algorithm behind the simulation, while the next section describes six “experiments” in which we calculate usage rates for different throwing patterns. Finally, conclusions are drawn by comparing the results to the data obtained by Frantz, where we find that Frantz likely detected a gender throwing bias in which players tended to throw to women less often.
The Simulation: Players, Throwers, and Passing1
The foundation of the simulation is the Player Object, in which a player on a team is assigned an ID number, gender (male or female), position (handler or cutter), and a “passing function” that encodes their throwing patterns.2
Now, the critical piece in this framework is the previously mentioned passing functions. Each player can have a different passing function, reflecting the fact that different players have different throwing patterns. Perhaps one player throws to handlers more than cutters, or one handler only throws to cutters (glory seeker!). The simulation framework allows for arbitrary passing functions, in which a player’s throwing pattern can be influenced by gender. If you started reading this article and asked “why simulations? Couldn’t we just calculate all this by hand?”, you would be mistaken. Only the most simple scenarios can be easily calculated by hand, and incorporating arbitrary throwing patterns for different players greatly complicates the math.3
All experiments discussed in the next section simulated one million throws for teams with 4M:3W lines. All lines had two male handlers and one female handler, with two male cutters and two female cutters. We are now in a position to investigate whether there exist throwing patterns that depend only on player positions (handler/cutters) that can recreate the difference in touches observed between men and women.
Experiments With Different Throwing Patterns
Six different experiments were performed with different throwing patterns encoded into the simulated players’ passing functions.
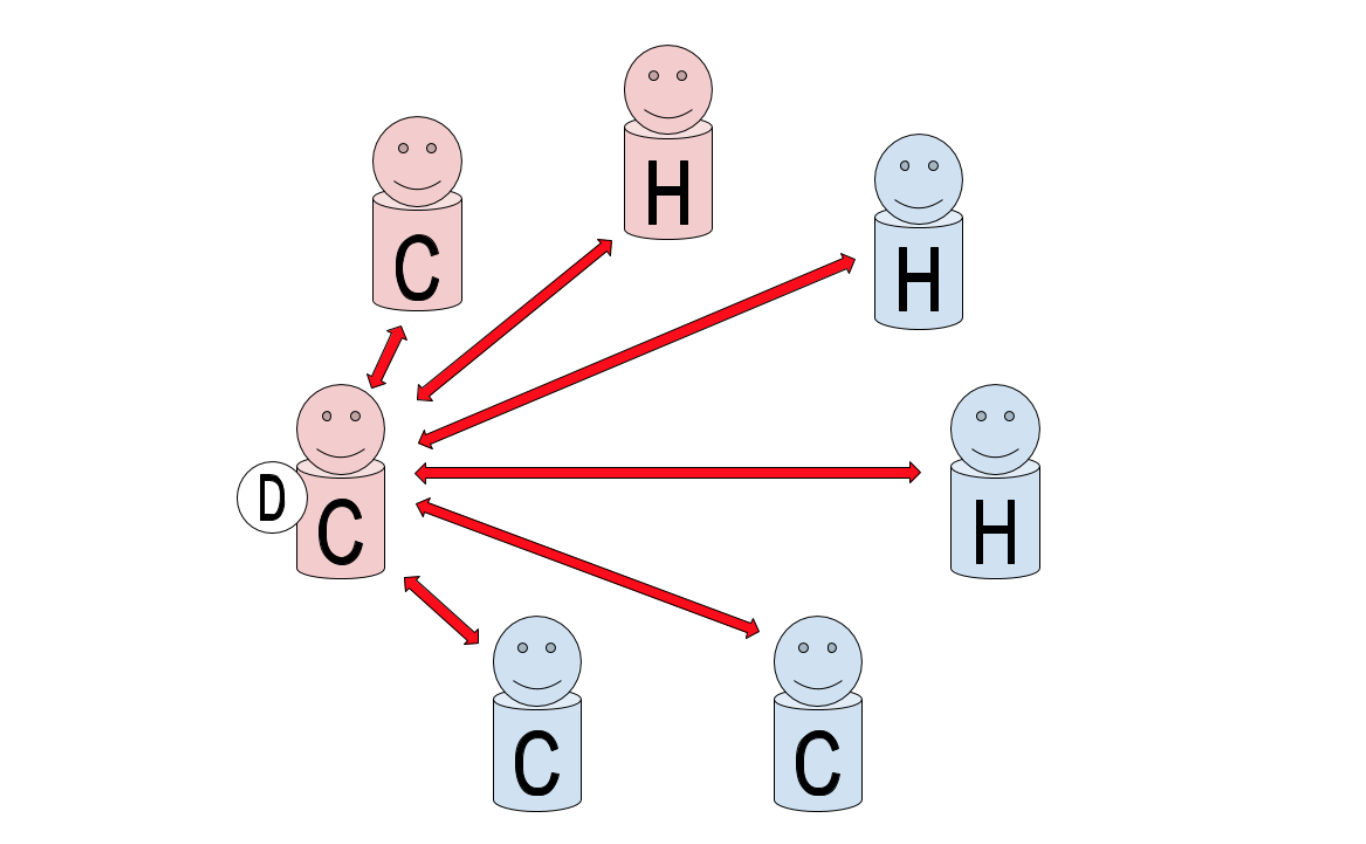
Experiment 1: The basic scenario in which players throw to their teammates randomly, as shown in Figure 1. This experiment recovers the 43% for women and 57% for men usage rates that one expects given the 4M:3W player composition.
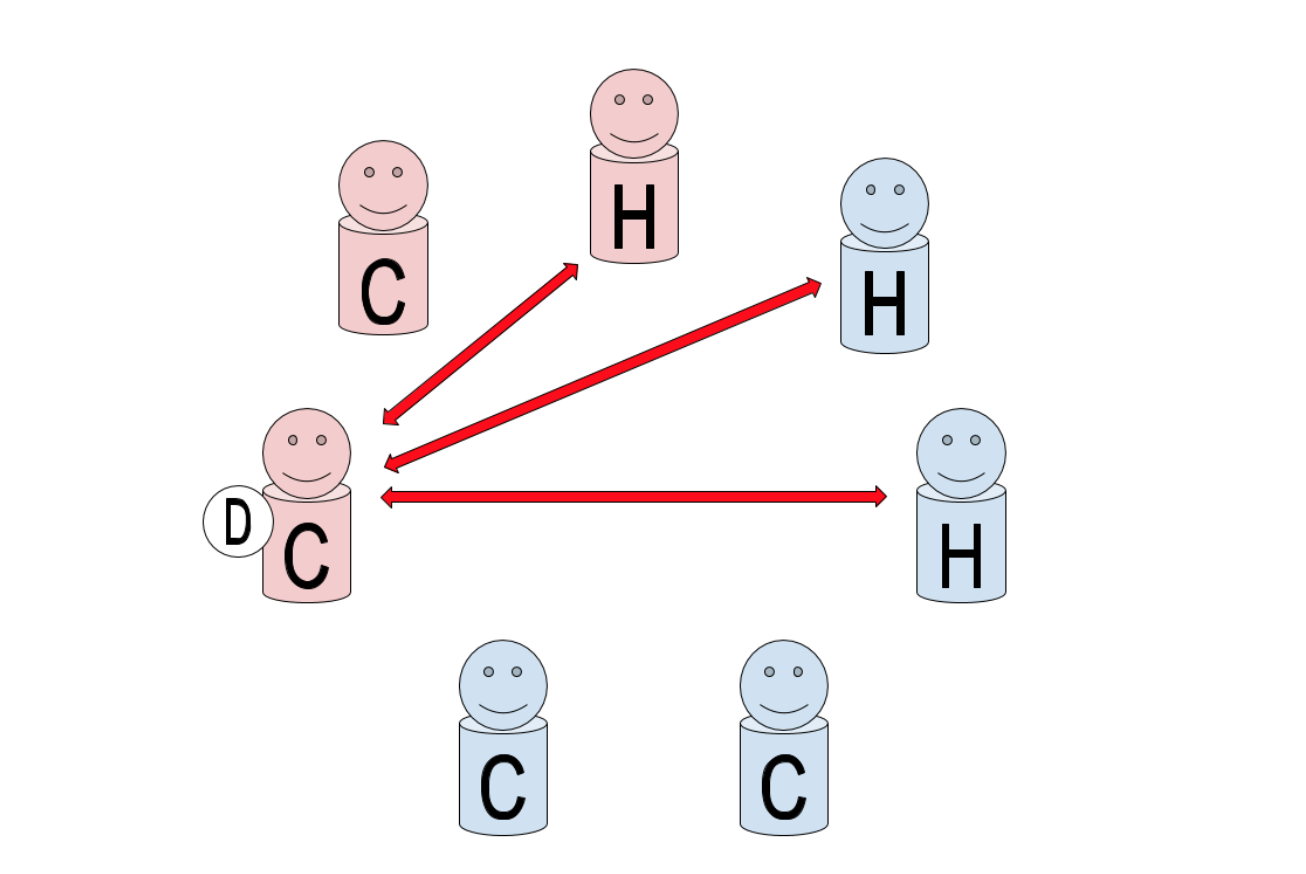
Experiment 2: The team uses “tactics” in which handlers only throw to cutters and cutters only throw to handlers. Given that there are two male handlers and one woman handler, this skews the usage rates between men and women, but only slightly with women receiving 42% of throws to 58% for men.
Experiments 3, 4, and 5: In these experiments, it is assumed that regardless of who has the disc, that player will throw to a handler more frequently than a cutter. In experiment 3, players threw to handlers two thirds of the time (66.6%). This is somewhat realistic, as it reflects the dump-swing-upfield throwing pattern one might see in actual play. A handler would get the dump, another handler would get the swing, and finally a cutter would get the upfield throw. Since there are two men handling, this further skews the gender usage rate, but only to 39% for women and 61% for men.
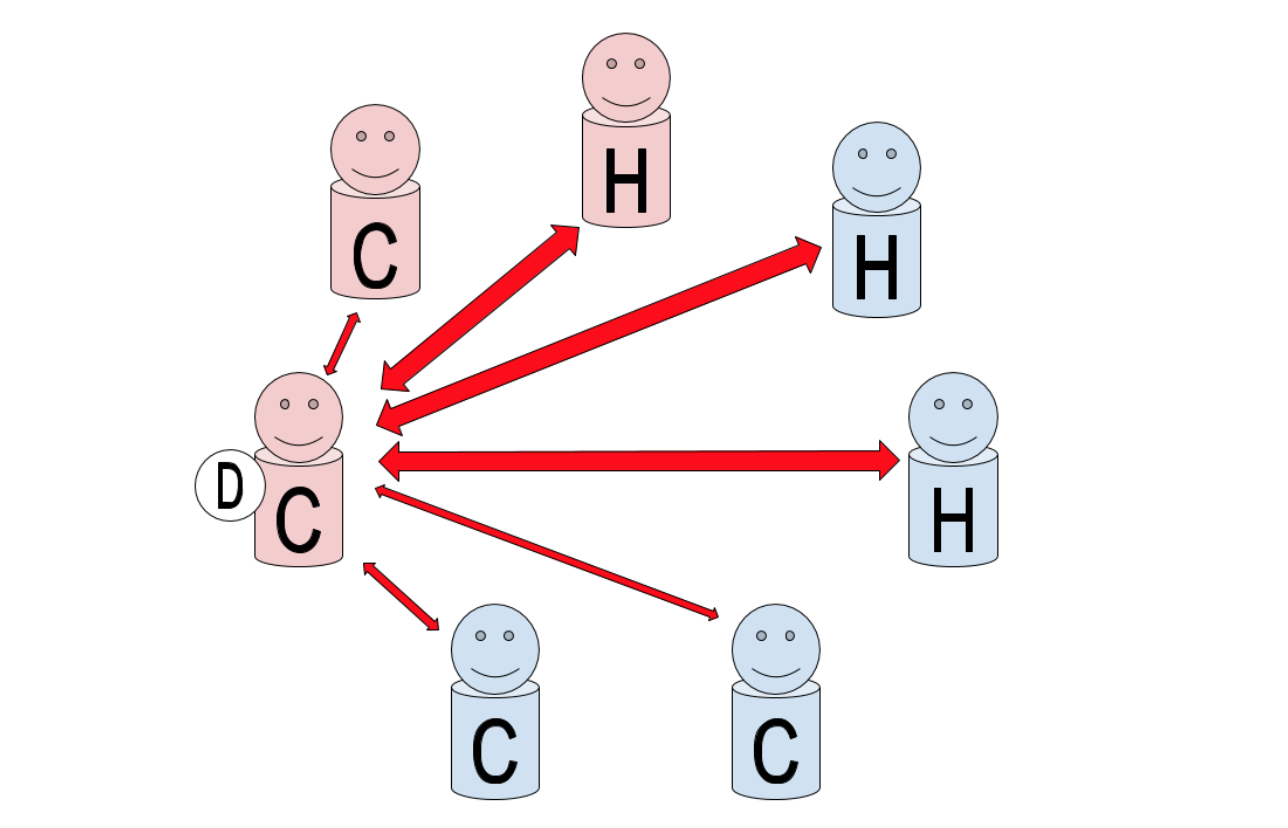
In experiment 4, the handler usage rate is exaggerated, with handlers always receiving 90% of passes, further widening the usage rate between genders to 35% for women and 65% for men. Extrapolating this trend, we can see that if handlers were the only ones to ever receive the disc in this scenario then the usage rates would asymptote to 66.6% for men and 33.3% for women, since there are two men and one women handling. These throwing patterns are illustrated in figure 3.
Experiment 5 simulates the situation in which cutters and handlers have very different throwing patterns. In this experiment, handlers could throw to anyone, but cutters threw to handlers 75% of the time. This resulting usage rates were 41% for women and 59% for men.
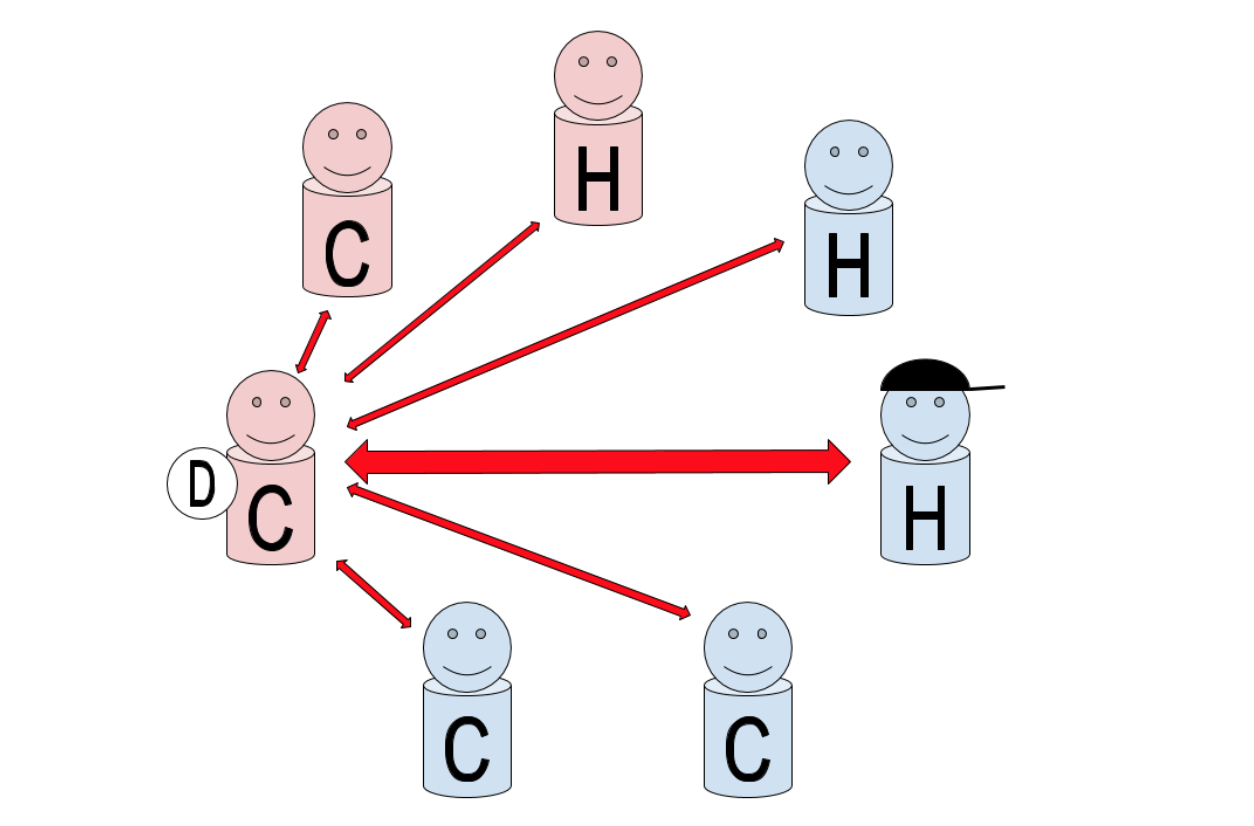
Experiment 6: Frantz’s article prompted much discussion involving the scenario in which a “dominant male handler” could account for the disparity in usage rates between genders by getting a large fraction of passes. This is easy to simulate, since we have access to player ID numbers in the passing functions. In this experiment, the player with ID #0 (a male handler, or Player0), always has a 50% chance to receive the disc if one of their teammates is throwing. The other 50% of the time, the thrower will throw to any of their teammates. If Player0 has the disc, then they will pass it to any of their teammates with equal probability regardless of position or gender. This scenario is shown in Figure 4, and after simulating one million throws the usage rates across genders were 33% for women and 67% for men.
Indeed, if we extrapolate this situation and pretend that Player0 received every other throw, or 50% of all their teams passes, then the other 50% of the touches would be divided evenly between the other six players (3M:3W), and the gender usage rates would be 25% for women and 75% for men.
Conclusions
In the games Frantz observed, women received 26% of their team’s touches, while men received 74%. This changed to 29% and 71%, respectively, when discounting dead disc pickups. Given that these games contained a few thousand throws, we know that the estimate of statistical error (or the size of random fluctuations) on these statistics is approximately +/- 2%. The statistical error on the simulations are negligible, and the results can be calculated to an arbitrary precision by simulating more throws. Comparing these data with the simulations described above, it is likely that Frantz observed a gender throwing bias, in which players tended to throw to women less often.
This result is robust against the assumption made in the simulations for 4M:3W lines, since any lines with four women and three men would only bring the simulated usage rates closer together, putting them in greater tension with Frantz’s observations.
However, some alternatives to a gender throwing bias are worth mentioning. While Frantz gives some discussion to the possible origin of the observed difference in touches in the appendix of the article, this difference could also occur due to the following:
- Teams had a dominant male handler that received a very large fraction of touches (>50%). This is very unlikely, since no team had players that played every offensive possession.
- Teams running lines with all male handlers, with high usage rates for handlers. This would suggest an intrinsic, strategic reason for running all male handlers. However this scenario is unlikely, since one can just watch the games and count how many possessions had three male handlers.
- The players observed had vast skill differences between genders, i.e. men are good and women are bad. This is very unlikely, given that these games all occurred at Nationals and included 22 different teams.
- The plays that teams ran under-utilized women/over-utilized men, meaning that there is a “strategic bias” rather than throwing bias that discourages throws to women. This is possible since, as Frantz observed, men tended to initiate plays and pick up the disc from a stoppage, although the latter has already been accounted for and does not change the conclusion.
- The Mixed Division in general allows for defensive strategies that make it more difficult for women to get open. Although Frantz observed only five help-defense plays involving a huck to a woman, this does not account for throws to women that were declined due to the presence of a poach or at least the threat of a poach. This scenario is possible, but is very difficult to simulate. Close study of recorded games and team strategy could illuminate this topic more.
Frantz’s work is monumental in that it is one of the first comprehensive studies of a large sample of games of ultimate. With increasing exposure of the sport in the future, and people like Frantz who are willing to do the hard work of studying hours and hours of tape, we can start to learn more about the advanced statistics in our game, as well as the sociological patterns they reflect.
Hopefully, in the future, a greater understanding of statistics in ultimate will elevate the level of play, level of enjoyment, and level of spirit across all divisions.
The simulation is available in a Python notebook found here, and the repository is hosted here. ↩
Player Objects can call their make_pass() function to pass to another member of their team. As one would expect, a Team Object is assembled from seven Player Objects. The Team Object is used to create a Usage Object which does the actual simulating, where the Usage Object takes a team, a number of throws to simulate, and an ID number for the player on the team that starts with the disc and then simulates a bunch of throws and catches. When the Usage Object simulates throws, it records all information about the receiver – the ID, gender, and position. ↩
As an aside – this framework could be as complicated as needed. It could be used to investigate racial throwing biases or accommodate additional positions such as deep cutters or players that only make swing passes. These possibilities are outside the scope of this article and are not very useful without real data from which to draw conclusions. ↩