May 20, 2015 by Scott Dunham in Analysis
Here are some key statistics about the College Championships, mostly about the Women’s Division.
Importance of Pool Play
The format of D1 Nationals has been consistent since the field was expanded to 20 teams in 2009. One question that always intrigues: how important is pool play in this format? The first observation is obvious: you need to be in the top 3 of your pool to make the bracket. But how advantageous is it to finish higher in your pool? The answer seems to depend on the division.
On the men’s side, the evidence is overwhelming that winning your pool is critical to boosting the chances of making semis. Over the past six years, 23 of 24 pool winners have made semis, with the lone exception being last year, when UNC-Wilmington upset Pitt.
On the women’s side, just 18 of 24 pool winners made semis. These results suggest that being rested for quarters is huge for the men, but not so much for the women. This may be changing, however, as over the last two years all eight Women’s Division pool winners have made semis.
The next question: does it matter whether a team finishes who claims 2nd and who is relegated to 3rd in the pool? For the men, the answer seems to be “no,” as just 13 of 24 2nd place pool finishers won their prequarters matchups vs. the 3rd place teams.
For the Women’s division, 18 of 24 teams finishing second in their pool made quarters, consistent with either these teams being a little stronger and/or having easier prequarters match-ups than their 3rd place counterparts.
Women’s Division Returners
Turnover is a natural force in college ultimate and has a major impact on the success or lack thereof of teams. All four of last year’s women’s semifinalists were laden with veteran returners. Taking a look at the statistics from the 2014 College Championships, we can gather an idea of what amount of firepower each teams brings back from last year. This table shows the percentage of goals, assists, Ds, and turnovers from last nationals that each returning team brings back in 2015.
I took the statistics from 2014 Nationals and calculated what fraction of the goals, assists, D’s and turnovers were allocated to players that are on the roster again this year. Red highlights denote teams returning less than 25%, while green highlights show teams returning more than 75%. Teams are listed by last year’s seeding.
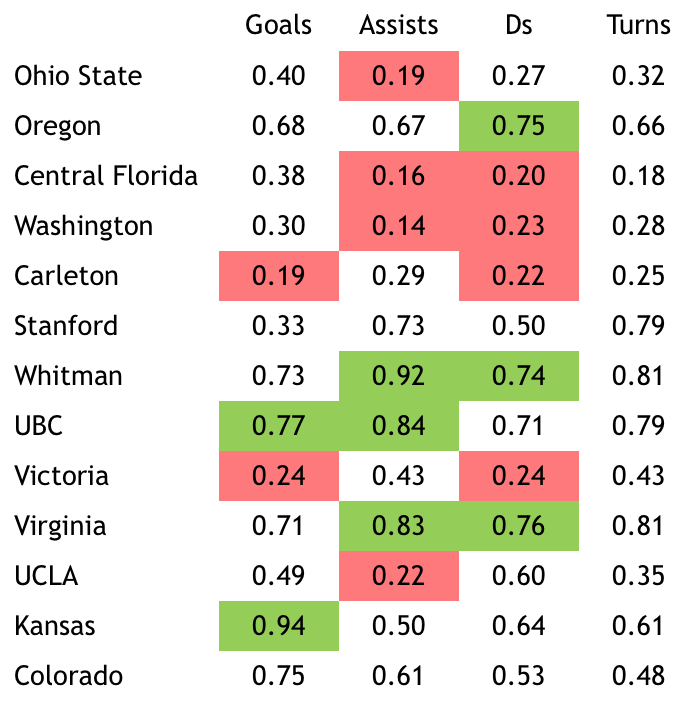
These results help to understand the move up in expectations for Whitman, UBC, and Virginia and the drops in ranking by UCF. However, some teams have overcome big losses. Washington brought in a cadre of grad students, while other teams added talented freshmen. It is interesting to speculate about why some teams (e.g., UCLA, Carleton, Victoria) appeared to have overachieved based on these numbers.1
Women’s Division Fantasy Tips
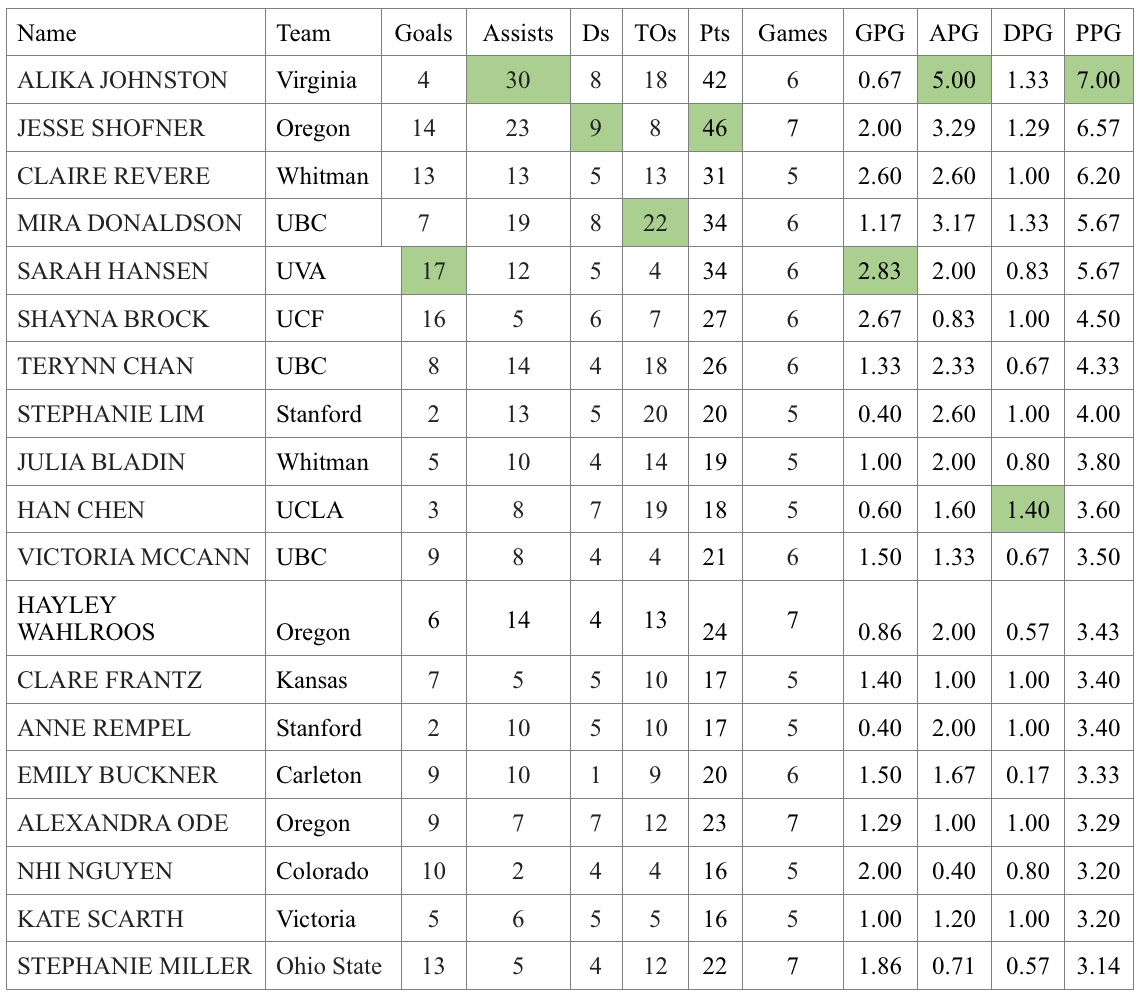
If you haven’t put together your team yet, here are some stats that might be helpful. Below are the top returners to D-I Nationals ordered by points per game (sum of goals plus assists plus Ds) at 2014 Nationals.
From The Women’s Rosters
Beyond the blurbs each team writes, you can get a feel for the make-up of the teams, and potentially their game strategies, by looking at the rosters. As an example, the two tallest teams (on average) at 2015 Nationals are the upstarts Notre Dame at 5’7.06” and Middlebury at 5’7”. Next down are Carleton at 5’6.65” and 5’6.24”.
In contrast, the shortest teams are Whitman (5’4.77”) and Ohio State (5’4.95”), not much smaller Virginia, Pitt, UBC, and Dartmouth, all between 5’5” and 5’5.1”.
The average ages are also telling, not only about how teams might perform at Nationals this year, but also about the future. As they noted on Twitter, FSU is the oldest team with an average age of 22.25 years, checking in at slightly older than Washington with their seven grad students at 21.95. Colorado, Stanford and Ohio State are all long in the tooth, with average ages between 21 and 21.2 years. The youngest teams are Princeton (19.96) and UBC (20.08), accompanied by fellow underage teams Pitt (20.25) and UCF (20.28).
Average ages can be skewed by a couple of senior grad students, so the median ages help fill in the story. UBC is clearly the youngest by this measure at 19.5 years, meaning that half the team are still teenagers. Pitt, Princeton, Stanford, Texas, UCLA, Victoria and Whitman are next up, all with a median age of 20. Florida State is the only team with a median age of 22, with most of the teams having 21 as the median age.
What is not included in this table is that some teams brought back players that were injured last year (e.g., Bethany Kaylor for Oregon and Michela Meister for Stanford), while teams like Kansas had injuries to top players that remain on the roster. ↩