A data-focused look at the MVP finalists.
October 3, 2017 by Dan Fiorino in Analysis
Since the AUDL has announced its five finalists for the MVP, there’s been plenty of chatter over who should win and, of course, if the finalists deserve their spots. What’s great about the AUDL format is that there is no other situation in ultimate that offers comprehensive and uniform statistics. With a few exceptions, every team, every player, every throw is recorded in the AUDL. Teams play the same number of games, mostly within their divisions, with a couple of cross-country challenge games thrown in there. Analyzing this large data set requires many hours of data cleaning to analyze, but that’s what I’ve spent the season doing so that you don’t have to.
Of course, the MVP discussion is nothing without a good story. Here I’ll run over the candidates, trying to sprinkle in some relevant numbers into that narrative.
I’d also like to recall a poll I ran on Twitter about what quality is preferred for an “All-AUDL” player. Out of 222 votes, 55% chose “Unique impact on the game.” 18% preferred “High stats per game” and “Top player on top team.” We’ll keep this in mind.
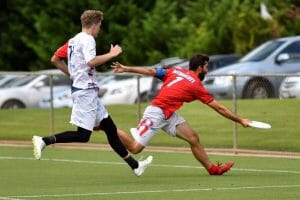
Jonathan Nethercutt (Raleigh Flyers)
Public sentiment (based solely on Twitter responses) is that the award belongs to Jonathan Nethercutt, the so-proclaimed “King in the South.” It’s mostly the beard, but also 99.9% based upon four key factors:
- His team’s 13-1 record
- His dominance of big time plays in big games (see v. Jacksonville 6/2)
- His impressive stats
- That amazing greatest for a score that shows up every other week in my social media feeds
As Charlie discussed in much greater detail in his recent Deep Look, Nethercutt also passes the “Most Valuable” eye test. He is the centerpiece of a top regular-season team.
The knock against him is the disappointing playoff loss to a very good Dallas team, one that had two regular season losses in one weekend while fielding a small roster. In that playoff game, Nethercutt played every offensive point and was on the field for every defensive break except for one. He had a 90% completion percentage while getting himself 10 assists, 6 hockey assists, and 5 goals. He wasn’t just on the field for 23 of Raleigh’s 24 goals; he was involved in 21 of them.
If any criticism could be made for that game, it should be about the lack of involvement of his teammates. The next three players in terms of these involvement stats (goals+assists+hockey assists) are a third of Nethercutt’s total (Jack Williams – 8, Matt Bode – 7, and Brian Casey – 6). Gone were the regular season contributions of Terrence Mitchell (3), Goose Helton (3), and Justin Allen (1). It’s probably best to give credit to the Dallas defense and move on, but when push came to shove, Raleigh deferred to Nethercutt.
| PlayerTeam | Involvement % | Games | Points Played (O/D) | Assists | HockeyAssists | Goals | Blocks |
|---|---|---|---|---|---|---|---|
| Pawel Janas-CHI | 51.9 | 14 | 391 (308/83) | 85 | 45 | 9 | 8 |
| Mark Burton-SEA | 43.6 | 12 | 315 (287/28) | 81 | 26 | 36 | 5 |
| Sean Mott-PHI | 40.2 | 14 | 374 (307/67) | 54 | 27 | 40 | 7 |
| Michael Pardo-CHI | 38.8 | 14 | 337 (273/64) | 17 | 17 | 70 | 21 |
| Rick Gross-IND | 36.5 | 14 | 345 (291/54) | 37 | 22 | 61 | 26 |
| Keenan Plew-IND | 35.3 | 14 | 371 (332/39) | 46 | 44 | 26 | 4 |
| Greg Cousins-MIN | 34.7 | 14 | 310 (270/40) | 32 | 18 | 62 | 11 |
| Cameron Brock-IND | 34.3 | 14 | 345 (306/39) | 43 | 23 | 47 | 6 |
| Travis Carpenter-IND | 34.0 | 14 | 410 (276/134) | 43 | 45 | 24 | 17 |
| Matt Smith-ATL | 34.0 | 14 | 341 (312/29) | 22 | 37 | 58 | 8 |
| Quentin Bonnaud-MON | 34.0 | 14 | 311 (255/56) | 27 | 30 | 49 | 17 |
| Jeremy Langdon-JAX | 33.6 | 10 | 283 (233/50) | 33 | 27 | 59 | 3 |
| Nathan Vickroy-ATL | 33.4 | 14 | 342 (301/41) | 45 | 24 | 46 | 12 |
| Josh Klane-MIN | 33.1 | 14 | 322 (282/40) | 63 | 33 | 11 | 5 |
| Travis Dunn-SD | 32.4 | 13 | 331 (227/104) | 31 | 35 | 37 | 6 |
| Ryan Osgar-MIN | 32.2 | 14 | 312 (272/40) | 41 | 20 | 43 | 15 |
| Jonathan Nethercutt-RAL | 31.8 | 11 | 286 (209/77) | 72 | 31 | 13 | 6 |
| Alec Arsenault-OTT | 31.5 | 12 | 264 (231/33) | 21 | 13 | 60 | 7 |
| Bobby Ley-JAX | 31.4 | 14 | 370 (336/34) | 55 | 37 | 19 | 13 |
| Anthony Davis-DET | 31.4 | 12 | 278 (247/31) | 10 | 12 | 54 | 12 |
| Justin Norden-SJ | 30.9 | 10 | 255 (229/26) | 59 | 34 | 14 | 7 |
| Jackson Stearns-SJ | 30.9 | 13 | 323 (284/39) | 22 | 28 | 57 | 10 |
| Cassidy Rasmussen-SF | 30.9 | 11 | 300 (240/60) | 54 | 34 | 32 | 10 |
| Cameron Harris-TOR | 30.6 | 13 | 309 (249/60) | 42 | 34 | 35 | 12 |
| Max Thorne-PIT | 30.1 | 10 | 248 (210/38) | 41 | 28 | 29 | 6 |
| Jordan Huston-JAX | 29.7 | 13 | 320 (272/48) | 11 | 14 | 80 | 3 |
| Jimmy Mickle-DAL | 28.9 | 12 | 372 (282/90) | 42 | 37 | 28 | 14 |
| Pat Earles-PIT | 28.8 | 10 | 249 (204/45) | 50 | 25 | 19 | 3 |
| Timothy Beatty-LA | 28.8 | 14 | 333 (313/20) | 47 | 39 | 11 | 2 |
| Doug Richardson-AUS | 28.6 | 11 | 274 (213/61) | 29 | 39 | 30 | 2 |
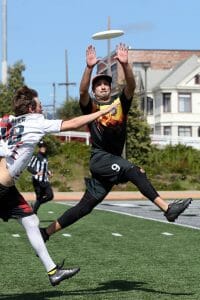
Cassidy Rasmussen (San Francisco FlameThrowers)
Rasmussen is an electric player who has all of the tools. He, along with Marcelo Sanchez, Lucas Dallmann, and Antoine Davis, earned San Francisco a spot in the AUDL playoffs so they could join a rested team of Beau Kittredge, Joel Schlachet, Ashlin Joye, Mac Taylor, Grant Lindsley, and Eli Kerns to win the championship. This is not the MVP story that most people want.
San Francisco didn’t upload any data from Championship Weekend, but that’s the story I saw. Based on the data from their first round matchup with the Los Angeles Aviators, Rasmussen (involved in six scores) took a back seat to Schlachet (12), who used his 46 touches to destroy defenses with quick give and go’s. Rasmussen was plenty involved, but no more than his teammates. It was just one of those games played with Intensity, Humility and Discipline. But, if any individual performance stood out, Schlachet’s unique abilities are what shone through in the playoffs.
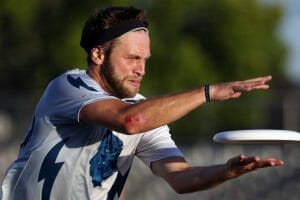
Mark Burton (Seattle Cascades)
Mark Burton dominated the Seattle scoring. He was involved in the goal, assist, or hockey assists on 44% of Seattle’s goals. On a tier below were his preferred end zone target Brad Houser (28%) and O-line/D-line hybrid Khalif El-Salaam (27%).
Burton loves to shoot to the endzone. In 2016, a jaw-dropping 50% of his recorded throws were assists. Of course, as I’ve learned, Seattle aren’t the best stat keepers; a closer look reveals that many games don’t record non-scoring throws. 2017 was a much better year for stats in Seattle and showed that Burton’s 4.4 throws per assist were 2nd in the league to Pittsburgh’s Sam Van Dusen (4.2). Van Dusen only had 104 throws to Burton’s 355.
Seattle made the playoffs last year in the brutal West division. This year, they only had Donnie Clark (2016 semi-final hero) for five games and Will Chen for four. Along with many absent Sockeye members, these omissions might have been too much to overcome this year, as Seattle missed the playoffs. Seattle still fit the bill of a playoff team in terms of their ability to convert possessions into scores and limit their opponents from doing so. Docking Burton for Seattle’s playoff whiff is a bit unfair in my opinion. Despite the roster turnover, Burton’s dominant role remained the same on a strong team.
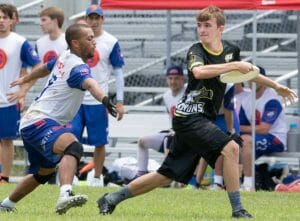
Bobby Ley (Jacksonville Cannons)
Ley is the lead handler on a team with Cole Sullivan. That, in itself, is an impressive feat. Sullivan, an efficient offensive player who completes the tough throws, was a near miss for the top 5 MVP candidates in 2016. In terms of usage, Ley accounted for 18.3% of Jacksonville’s throws and completed 94.5%. Combining those two numbers is a handler stat that I call “handler number.” Ley finished 5th in the league behind Dom Leggio (SD), Pawel Janas (CHI), Keenan Plew (IND), and Tim Beatty (LA).
| PlayerTeam | Handler Number | Usage % | Completion % | Games | Points Played (O/D) | Assists | Hockey Assists | Goals | Blocks |
|---|---|---|---|---|---|---|---|---|---|
| Dom Leggio-SD | 115.3 | 17.5 | 97.8 | 14 | 380 (271/109) | 24 | 42 | 12 | 12 |
| Pawel Janas-CHI | 114.9 | 22.2 | 92.7 | 14 | 391 (308/83) | 85 | 45 | 9 | 8 |
| Keenan Plew-IND | 114.0 | 17.9 | 96.1 | 14 | 371 (332/39) | 46 | 44 | 26 | 4 |
| Timothy Beatty-LA | 112.8 | 15.1 | 97.7 | 14 | 333 (313/20) | 47 | 39 | 11 | 2 |
| Bobby Ley-JAX | 112.8 | 18.3 | 94.5 | 14 | 370 (336/34) | 55 | 37 | 19 | 13 |
| Thomson McKnight-TOR | 110.7 | 14.4 | 96.3 | 14 | 323 (288/35) | 21 | 50 | 9 | 4 |
| Chuck Cao-SJ | 110.7 | 13.6 | 97.1 | 12 | 305 (267/38) | 46 | 26 | 6 | 4 |
| Josh Klane-MIN | 110.3 | 18.4 | 91.9 | 14 | 322 (282/40) | 63 | 33 | 11 | 5 |
| Max Trotter-CHI | 109.7 | 13.6 | 96.1 | 14 | 299 (257/42) | 11 | 26 | 6 | 6 |
| Jon Mast-PIT | 108.6 | 12.6 | 96.0 | 14 | 295 (251/44) | 30 | 34 | 9 | 9 |
| Justin Norden-SJ | 108.3 | 12.8 | 95.5 | 10 | 255 (229/26) | 59 | 34 | 14 | 7 |
| Andrew Brown-MAD | 107.9 | 9.3 | 98.6 | 9 | 160 (144/16) | 19 | 22 | 3 | 2 |
| Chris Mazur-DAL | 107.8 | 13.3 | 94.5 | 12 | 336 (267/69) | 41 | 31 | 17 | 6 |
| Jason Tschida-MIN | 107.7 | 11.2 | 96.5 | 12 | 281 (168/113) | 14 | 31 | 11 | 10 |
| Kyle Stapleton-ATL | 107.7 | 9.8 | 97.9 | 13 | 269 (207/62) | 16 | 28 | 8 | 5 |
| Brandon Malecek-DAL | 107.3 | 14.1 | 93.2 | 14 | 340 (301/39) | 32 | 49 | 9 | 7 |
| Matt Smith-ATL | 107.2 | 8.9 | 98.3 | 14 | 341 (312/29) | 22 | 37 | 58 | 8 |
| Steven Chang-SJ | 107.2 | 10.2 | 97.0 | 11 | 299 (270/29) | 25 | 25 | 16 | 4 |
| Lloyd Blake-DC | 107.1 | 11.2 | 95.9 | 13 | 287 (220/67) | 28 | 37 | 15 | 12 |
| Jonathan Nethercutt-RAL | 107.0 | 12.6 | 94.4 | 11 | 286 (209/77) | 72 | 31 | 13 | 6 |
| Travis Carpenter-IND | 106.7 | 13.8 | 92.9 | 14 | 410 (276/134) | 43 | 45 | 24 | 17 |
| Trey Katzenbach-PHI | 106.7 | 7.5 | 99.2 | 11 | 243 (213/30) | 10 | 12 | 9 | 4 |
| Derek Alexander-OTT | 106.7 | 14.5 | 92.2 | 10 | 271 (258/13) | 46 | 25 | 8 | 3 |
| Max Leonard-ATL | 106.4 | 9.0 | 97.4 | 9 | 215 (198/17) | 24 | 25 | 14 | 1 |
| Zeke Ivers-SD | 106.1 | 11.6 | 94.5 | 14 | 308 (252/56) | 42 | 21 | 9 | 4 |
| Connor Armstrong-TOR | 105.6 | 9.7 | 95.9 | 13 | 281 (250/31) | 11 | 10 | 17 | 7 |
| Doug Richardson-AUS | 105.6 | 10.6 | 95.0 | 11 | 274 (213/61) | 29 | 39 | 30 | 2 |
| Cole Sullivan-JAX | 105.3 | 10.7 | 94.6 | 9 | 220 (198/22) | 42 | 36 | 19 | 4 |
| Sonny Zaccaro-SJ | 105.2 | 9.2 | 96.0 | 12 | 287 (216/71) | 20 | 26 | 10 | 5 |
| Noah Saul-RAL | 105.0 | 10.2 | 94.8 | 11 | 267 (185/82) | 26 | 30 | 21 | 7 |
Knowing this, it should come to no surprise that Jacksonville’s offense struggled mightily during Ley’s early absence in the playoff vs. Dallas. Dallas put Jacksonville in a hole early and never surrendered the lead, but one can’t help but imagine what could have been without the (and forgive the awful pun here) de-leyed start.1 Without Ley, the Cannons’ offense converted 6 of 13 offensive points. It didn’t get much easier with Ley (6 of 12). Ley was certainly not able to change the tide of that game. Again, credit the Dallas defense.
Jeff Babbitt (New York Empire)
Jeff Babbitt is unique amongst the five finalists, simply because he’s a defensive player. He led the league in blocks with 41, which is off the all-time high by just eight2. What stands out most are Babbitt’s impressive statistical numbers despite playing 70% of his points on the D-line. What should stand out even more is that he played 83% of New York’s defensive points and 37% of their offensive points. Nobody played that much defense while playing such a large portion of their team’s points. Only teammate Ryan Drost (87%) played more D.
His impact was most often noticed while sliding over to help a teammate on a floaty throw. His sense for those moments led to some pretty impressive chase down blocks.
Much can be made of New York 6-8 record, leaving them three games out of the last East playoff spot. That could weigh down his candidacy. All in all, Babbitt was the anchor of an impressive defense that, like San Diego in the West, kept them in many games. New York scored one-third of their goals on defensive breaks (0.50 break-to-hold ratio) . This is a higher ratio than 6 of the 12 playoff teams, including the eventual champions. The only teams with a higher ratio of breaks to offensive holds were the other six playoff teams (see below table).
| Team | Breaks to Holds |
|---|---|
| Minnesota | 0.66 |
| Madison | 0.63 |
| Toronto | 0.61 |
| Raleigh | 0.56 |
| DC | 0.52 |
| Dallas | 0.52 |
| New York | 0.51 |
| Pittsburgh | 0.49 |
| Montreal | 0.47 |
| San Francisco | 0.47 |
| Indianapolis | 0.46 |
| Seattle | 0.44 |
| Los Angeles | 0.44 |
| San Diego | 0.41 |
| Chicago | 0.41 |
| Jacksonville | 0.38 |
| Philadelphia | 0.36 |
| San Jose | 0.35 |
| Austin | 0.34 |
| Atlanta | 0.3 |
| Detroit | 0.29 |
| Vancouver | 0.28 |
| Ottawa | 0.28 |
| Nashville | 0.14 |
Edit (10/3/2017): New York’s break-to-hold ratio 0f 0.50 means that one-third of their goals were breaks, not one-half.