March 29, 2019 by Dan Fiorino in Analysis
Getting ready for the 2019 AUDL season means it’s almost time for new data! 2018 was a busy one for me, though. Between moving, getting married, and beginning a new job at a startup, I haven’t done enough with the data I already have! In preparation for the new season, here’s some new fun with the old data.
Breakout Seasons
We’ve seen some stat-stuffing performances. There are the more obvious cases like Mischa Freystaetter exploding box scores with Jacksonville in 2016, Jeff Babbitt outproducing most of the league from the Empire D-line in 2017, and the Flyers’ Jack Williams menacing defenses last year. Then there are the performances that catch us a bit by surprise like Sean McDougall and Rowan McDonnell last year.
Those breakout seasons are exciting. It’s exciting to see new names doing great things. Plus, the counting stats are easy to tabulate and understand. So, here’s my question: can the past tell us anything about breakout seasons? As you’ll see, there are a few scenarios to watch out for. Who knows: we might just be able to call a few breakouts and look smart!
1. Get your data
Getting data has never been easier, because that is where most of my work has gone for SOTG Stats. Armed with the 2014–2018 AUDL data from my very own data set, I set out to find trends in player evolution over those years.
2. Choose your metric
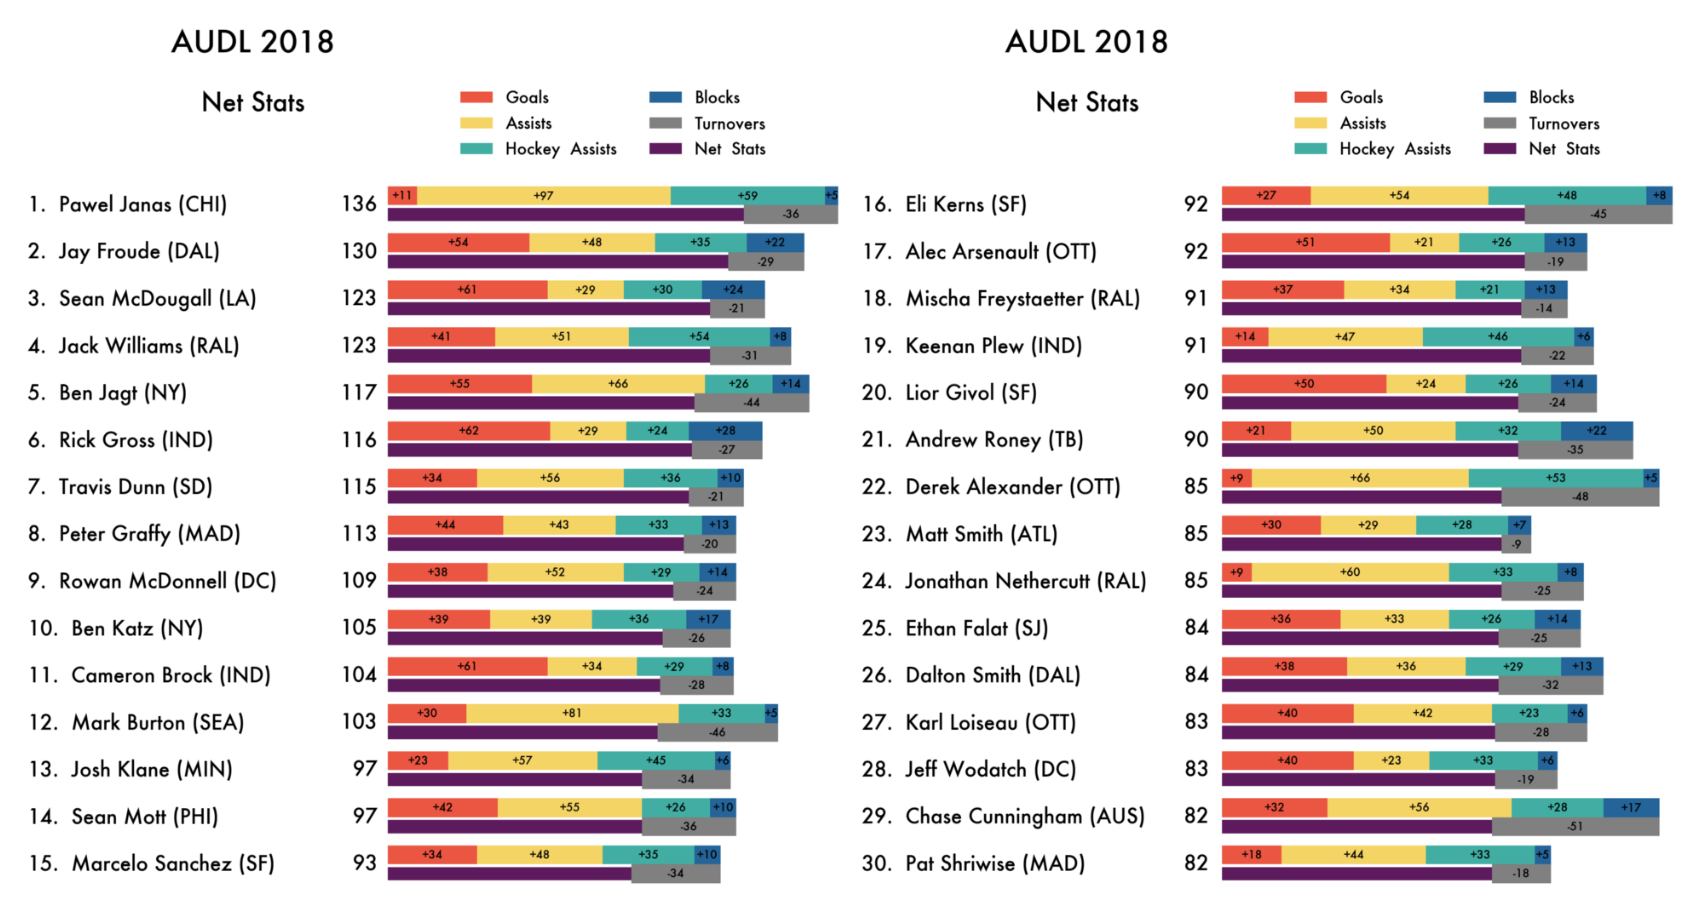
To measure a player’s statistical impact, I use a combined counting metric that I call Net Stats, or ‘Net’ for short. Net is simply: Goals + Assists + Hockey Assists (the pass before the assist) + Blocks – Turnovers. These are the most influential plays in the game, plus the hockey assist. The hockey assist boosts players who get lots of touches and help their team move the disc. The leaders in Net Stats from last season are shown below. The calculation is broken into its parts, and the purple line shows the result of those additions and the one subtracted value (turnovers) to get Net.
3 . Remove (Reed) Noisy Outliers
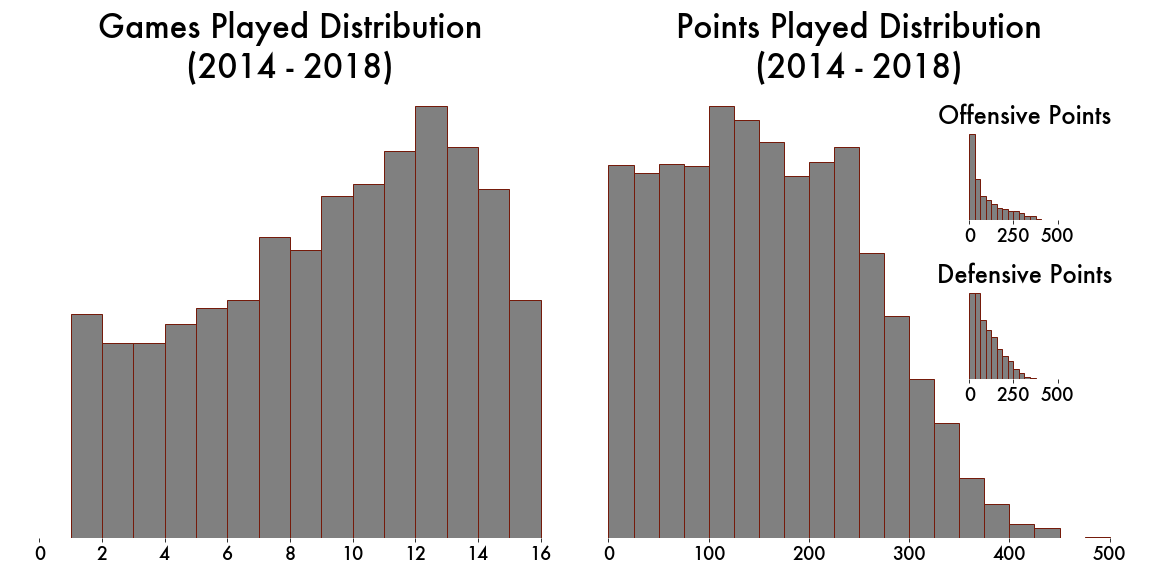
Also, we’ll need to remove outliers like Reed Hendrickson and his single game with 14 Net (6 goals, 4 assists, 4 hockey assists, and 1 block) in 2018 for the Cascades. Truly impressive, Reed, if not fleeting. Setting a minimum on games and points played should do the trick. The decisions for minimums are based on the distributions of games played and points played (below). I chose to exclude the area before the distributions begin to rise, removing low volume outliers. I chose a minimum of seven games and 100 points played.
4. Data Discovery
To find breakout seasons, we want to look at each player’s change from year to year. So, we want ‘Net per Game’ to account for games played.
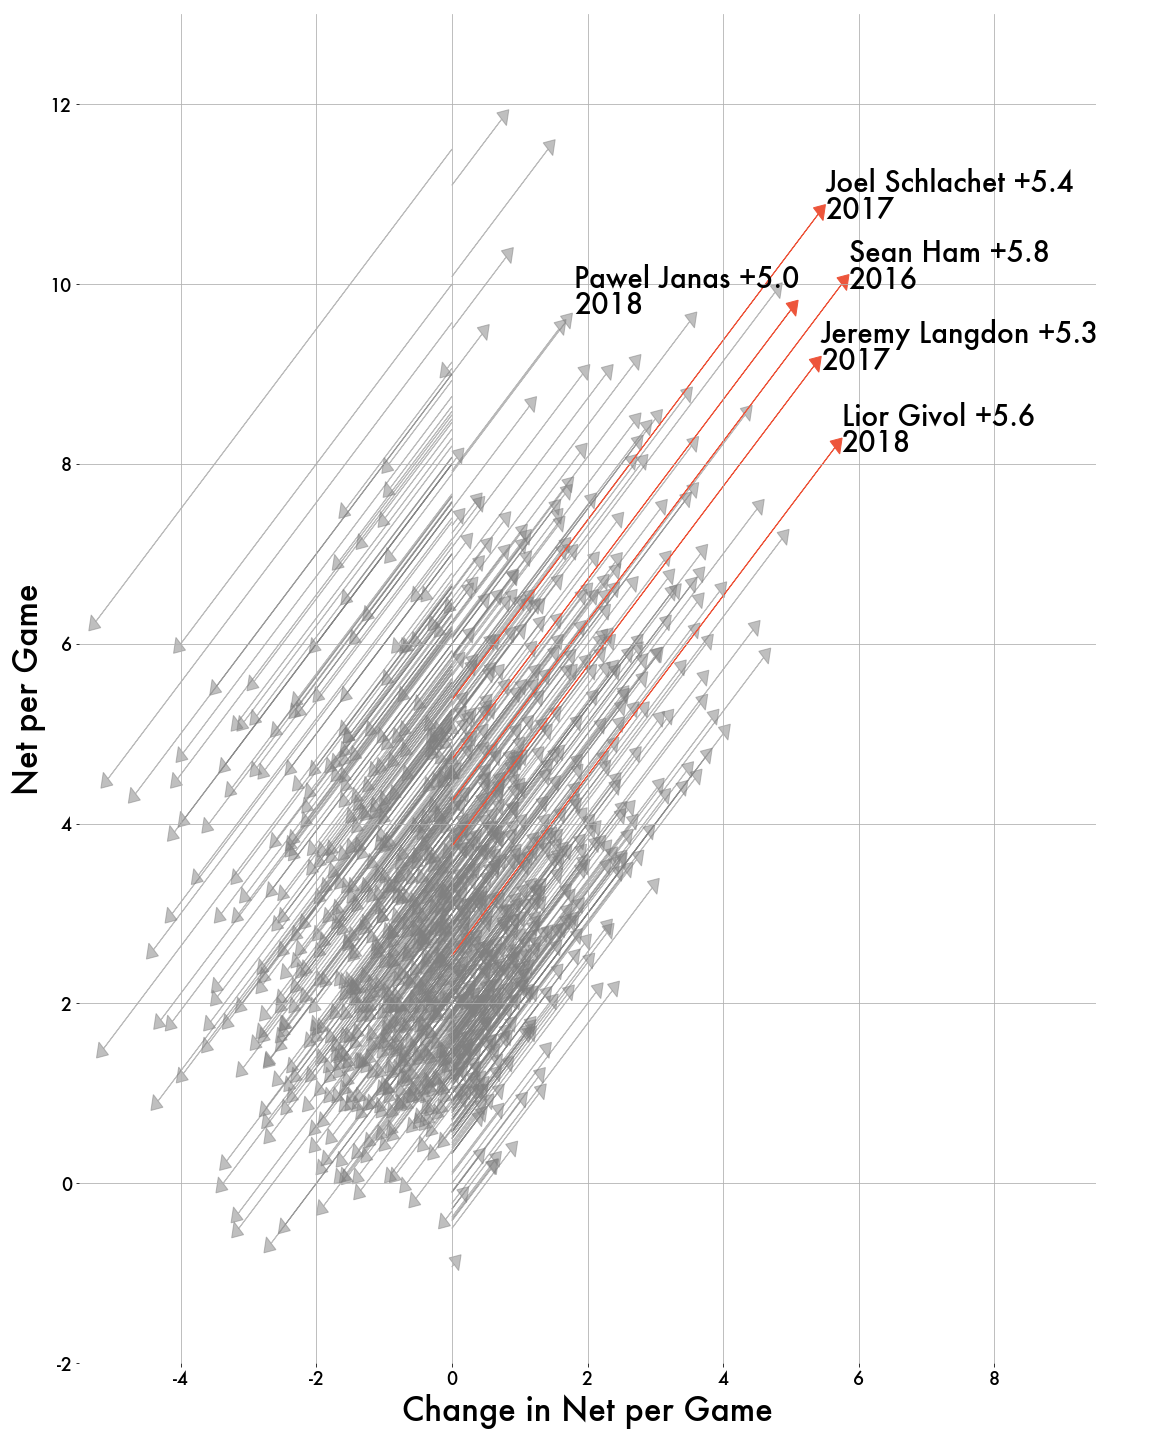
Below is a visual of change in Net per Game for every season and every player between 2014–2018 (with outliers removed). Each arrow represents two consecutive seasons by a single player. Arrows pointing up and to the right show an increased Net per Game from the previous season. I’ve highlighted and labeled the top five increases.
Joel Schlachet, for example, doubled his Net per Game from 2016 to 2017. You can see that the highlighted red arrow for Schlachet starts at 5.4 Net per Game and ends up 10.8 Net per Game. You can read the Change in Net per Game between those seasons was 5.4, by seeing how far right the tip of arrow is (it’s also written next to his name).
5. Profit…err, Insight!
So what can we learn from these five case studies of breakout seasons?
One theme is opportunity. A deeper look into these evolutions, shows that Schlachet, Jeremy Langdon, and Lior Givol all benefited from switching from D-line to O-line during their breakout years. Like it or not, offense is where the high Net per Game players play. The 2017 FlameThrowers wisely gave Schlachet 100 more O-line points. The departure of Beau and several other FlameThrowers in 2017 left an O-line spot open for Givol. Langdon had just moved from a stacked 2016 Dallas Roughnecks where he only played 150 points. All three excelled given the opportunity.
You probably can’t predict additional offensive playing time with data, but it’s something you might be able to infer from roster moves and past performance. One strategy is to look for high performing D-line players who move to O-line. This was exactly the case for 2018 MVP Rowan McDonnell (+4.8), who traded in 100 of his previous year’s D-line points for O-line points. His 2018 breakout season is the gray arrow between Schlachet’s and Pawel Janas’s.
Sean Ham made his evolution following a year of decent production while staying on O-line. So, another strategy is to look for existing O-line players looking to step into a bigger role. Sean Ham filled the void left by Revolver (Beau & Co.) pulling out of the San Jose Spiders in 2016.
The other theme is enhancements. Pawel Janas was already producing ridiculous numbers in 2017, but the addition of Kurt Gibson, Ross Barker, and Nate Goff helped him cut his turnovers from 81 to 36 while actually increasing his production. With that in mind, a third strategy is to look for O-line centerpieces who added impactful teammates.
6. So, who makes the leap?
Having laid out three strategies, I dug into the data to look for players that fit those characteristics.
Strategy 1A: High Performing D-line players.
It’s hard to imagine teams changing up such a good thing, but there is precedent with McDonnell (DC) last year. And Madison tip-toed into that path with their star Peter Graffy. My stab in the dark is that Madison continues that trend and moves Andrew Meshnick (MAD) at least half-time onto O-line.
Notable Mentions: Kevin Pettit-Scantling (MAD), Dillon Larberg (DAL), Zach Theodore/Jeffery Silverman (LA), Noah Saul (RAL), Mike Drost/Ryan Drost/Jeff Babbit (NY), Iain Mackenzie (TOR), Nick Boucher (OTT)
Strategy 1B: Up and coming D-line players
Through only 8 games last season, Nate Goff (CHI) terrorized opposing offenses for the Chicago Wildfire, personally ending 9.3% of opponent possessions. He also showed an ability to help his team score — posting 17 goals, 16 assists, and 11 hockey assists. While his 13 turnovers on 121 throws is high, 12 of those came while playing on D-line. The plentiful additions to Chicago’s defense and offense should help turn some of those miscues into scores and also provide more opportunity for scores.
Notable Mention: Sam Fontaine (SD), Nick Hutton/Donovan Triplett (IND), Jason Huynh (TOR), Matt Esser (PHI), Shane Worthington (SEA), Aaron Weaver (LA), Adam Carr (TB)
Strategy 2: Existing O-line players
The Raleigh Flyers have more than half of an O-line to replace. Luckily, they also have a stable of reliable veterans to pick up the production. My guess is that someone reaps the benefits in the box score. Terrence Mitchell is my pick to see the biggest uptick in Raleigh. Mitchell is an intelligent cutting speedster and a perfect complement to Jonathan Nethercutt’s love of the long ball. Oddly enough, Mitchell has seen his touches go down since his rookie season in ’15. His Net peaked in ’16 at 71 while throwing 25 assists on 213 throws. It is certainly plausible the Flyers give Mitchell more of the offense.
Notable Mention: Cam Burden/Tate Halberg (MIN), Quentin Bonnaud (MTL), Connor Olsen (DAL), Antoine Davis (SJ), Kyle Henke (AUS)
Strategy 3: O-line centerpieces with added impactful teammates
New York Empire made the biggest splash this offseason adding Grant Lindsley and Jack Williams. The one with the most to gain is gunslinger Harper Garvey (NY). Garvey made a ridiculous 742 throws with 53 turnovers in ’18, an increase of 250 throws and only 2 turnovers from ’17. That high usage only totaled 53 Net. Lightening the offensive load should make Garvey and his full-field throws more potent.
Notable Mention: Kodi Smart (SEA), Christian Olsen/Paul Lally (ATL), Ross Barker (CHI), Justin Norden (SJ)
***
I feel pretty good about three of those picks! After all, Tim DeByl loves keeping his stars on defense. And some of the notable mentions were tough to call breakouts, like San Jose’s Davis and Norden, who have proven to be high-producers given the chance. This should be a fun post to come back to later in the season (for better or for worse).
I conclude with a PSA: counting stats like Net are easy to understand and measure, but I fully realize that counting stats aren’t the only measure of impact on the ultimate field. Trust me. I get it. I just watched an hour of Andre Iguodala Warriors highlights in penance for this article. Measuring individual impact in a team sport is hard. Really, really hard. I know, because I’ve been trying to come up with a metric for ultimate for a while now. Should make for a good next article!
Notes
- audl-pull is my open-source Python tool to enhance AUDL data. I’ve done my best translating the usernames provided in the AUDL data into the actual person’s name.
- If you see mistakes/omissions, then please download that file, fill in the blanks or make corrections, and send it my way.
- I love the hockey assist. I agree that it is occasionally meaningless, though. For example, a bail out dump to a scoring huck. But it is a serviceable stand in for crediting completed throws.
- There are plenty of biases in Net. First, Net is tragically biased towards O-line players. True. We also shouldn’t penalize a player whose team is not successful and, thus, is limited in ability to produce a lot of Net. Neither should it penalize a team that plays a much slower-paced game (hello, Radicals). Those are weaknesses that can be addressed by weighting Net. It’s a bit messier, and a topic for the future.
- Leave me some comments. I’ll even read them!