The data behind the rosters.
March 18, 2020 by Charlie Enders and Charlie Eisenhood in Analysis with 0 comments
Back in December, we took a look at the USA National Team tryout invitations by the numbers. Now with the team selected, we dive back into the numbers to take a closer look at the makeup of the three rosters.
What were the splits between the single gender and mixed divisions in tryouts vs. rosters?
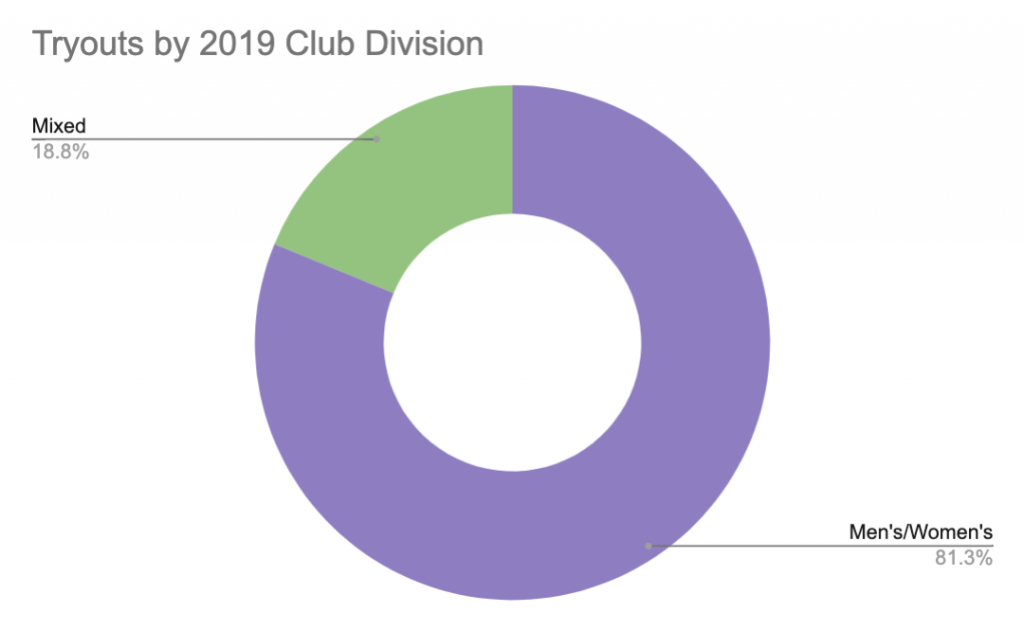
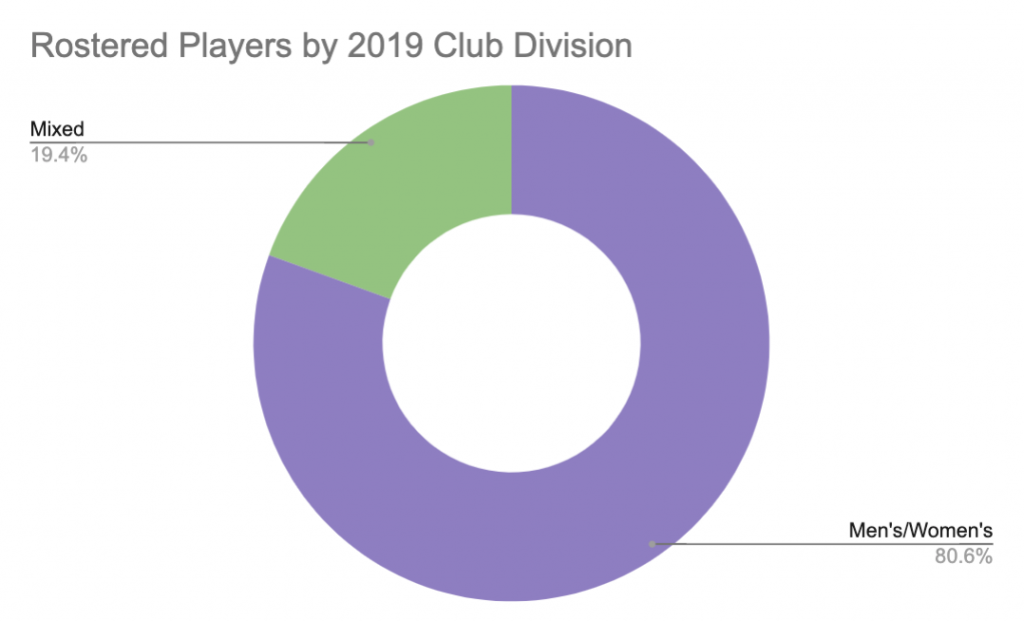
Notes:
– In 2016, 9.9% of the rostered players competed in the Mixed Division.
What were the divisional splits on each individual roster?
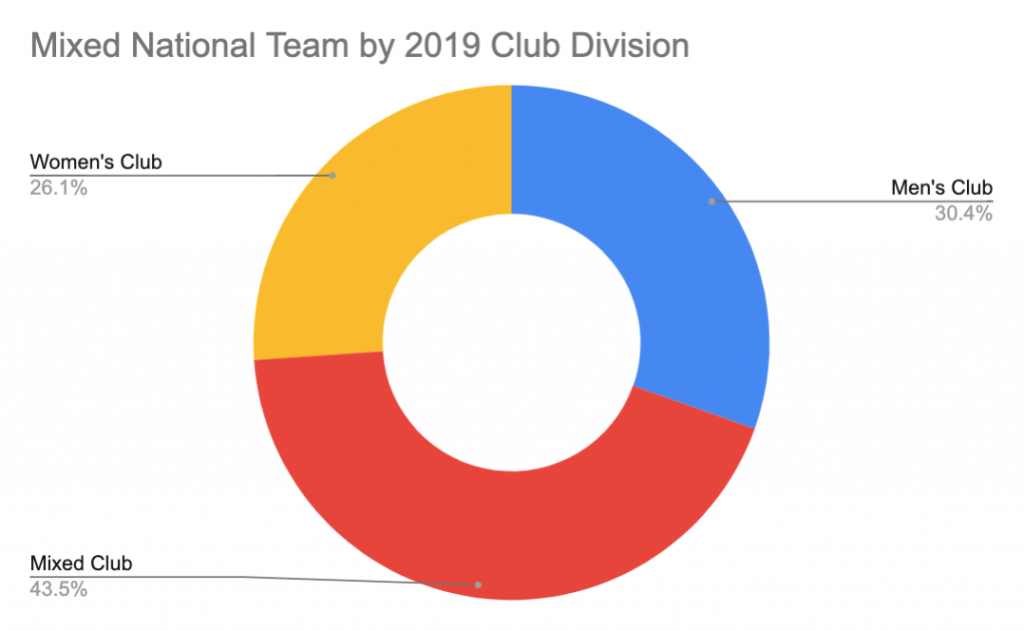
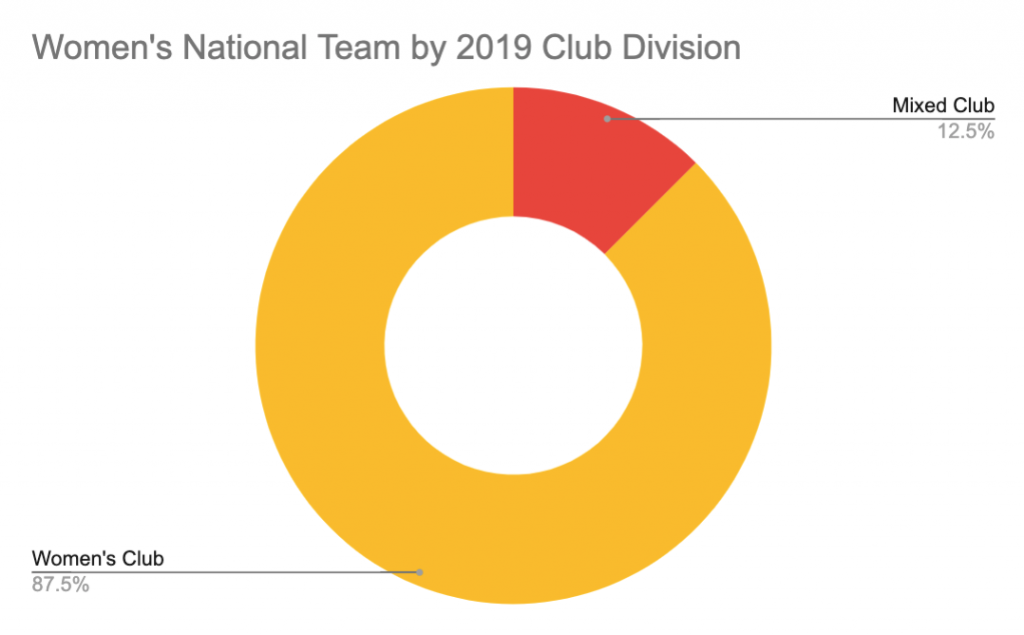
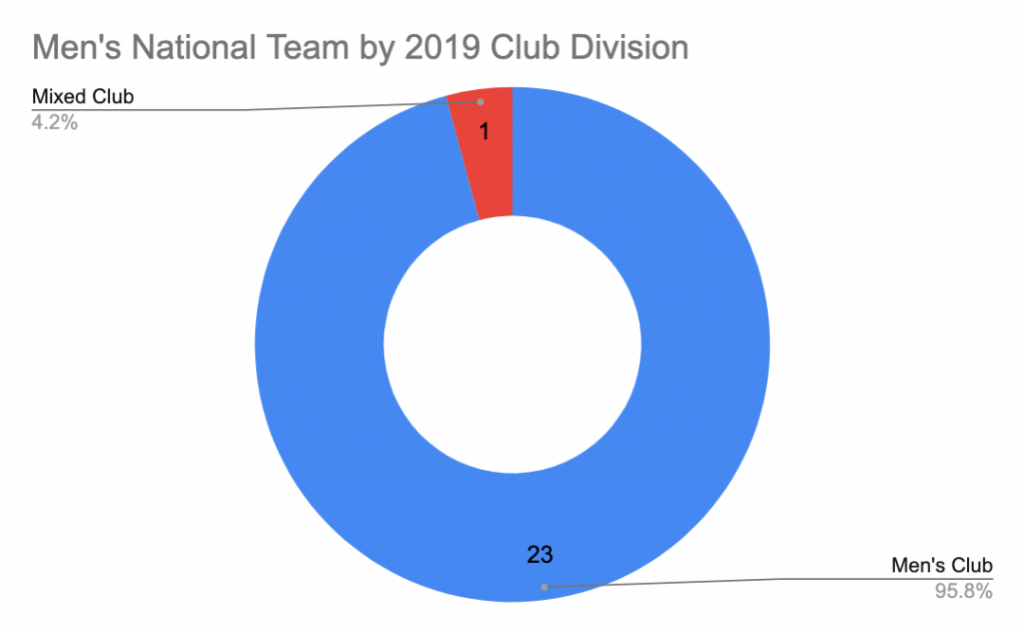
Notes:
- There were no mixed division players on the men’s roster in 2016. There was only one player on the women’s roster. There were six on the mixed roster.
What are the state-by-state breakdowns for the rosters?
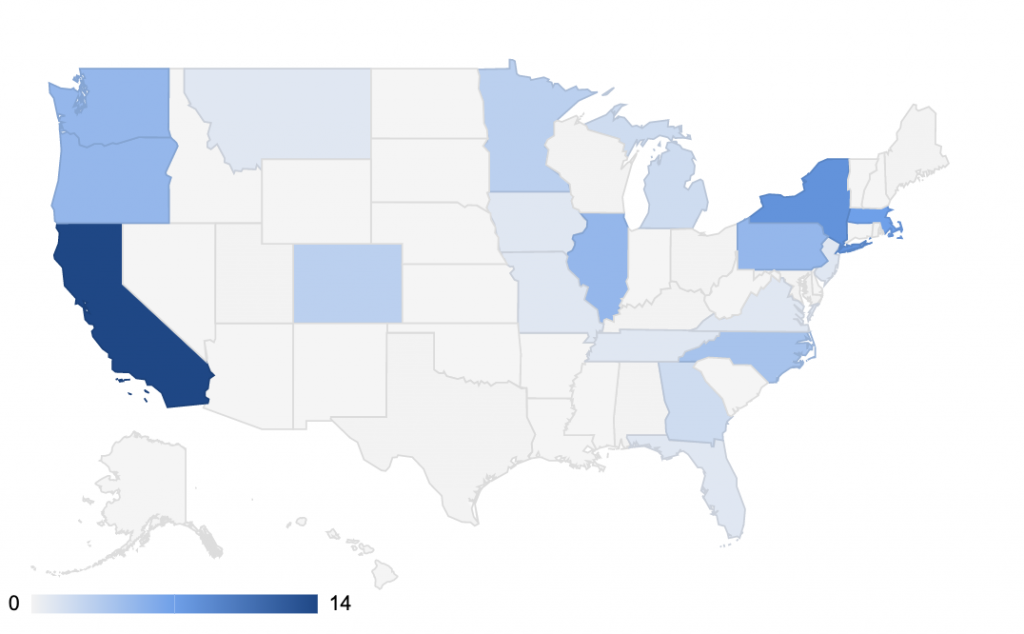
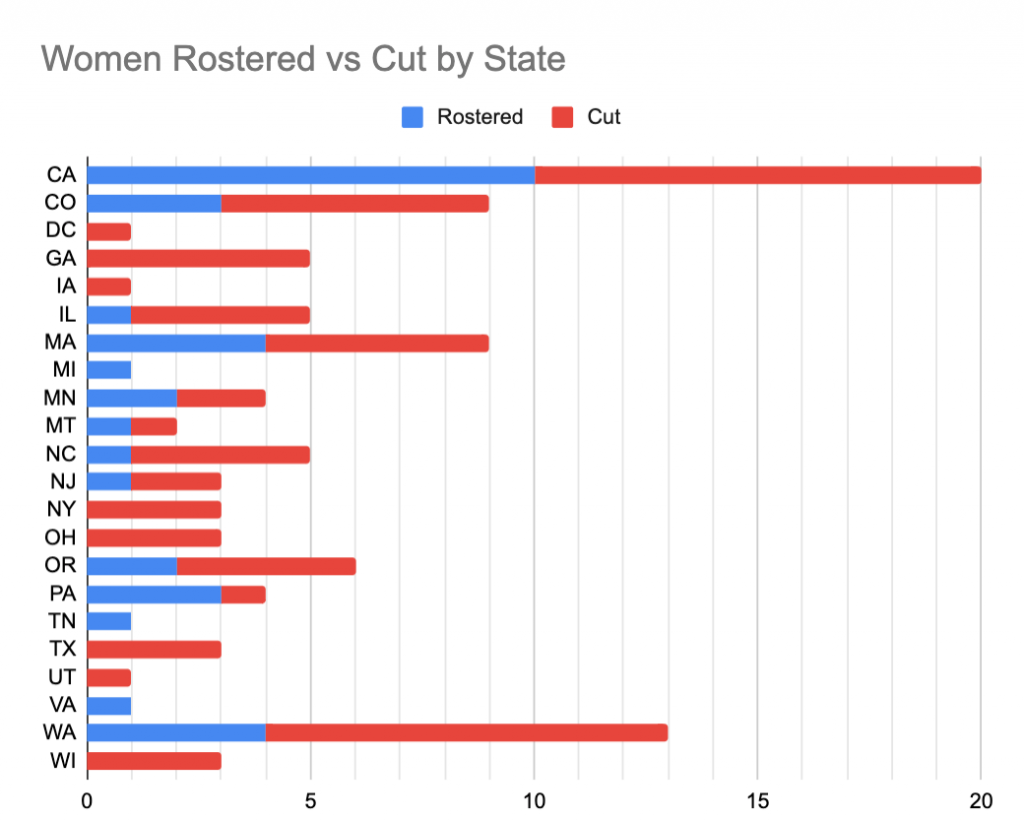
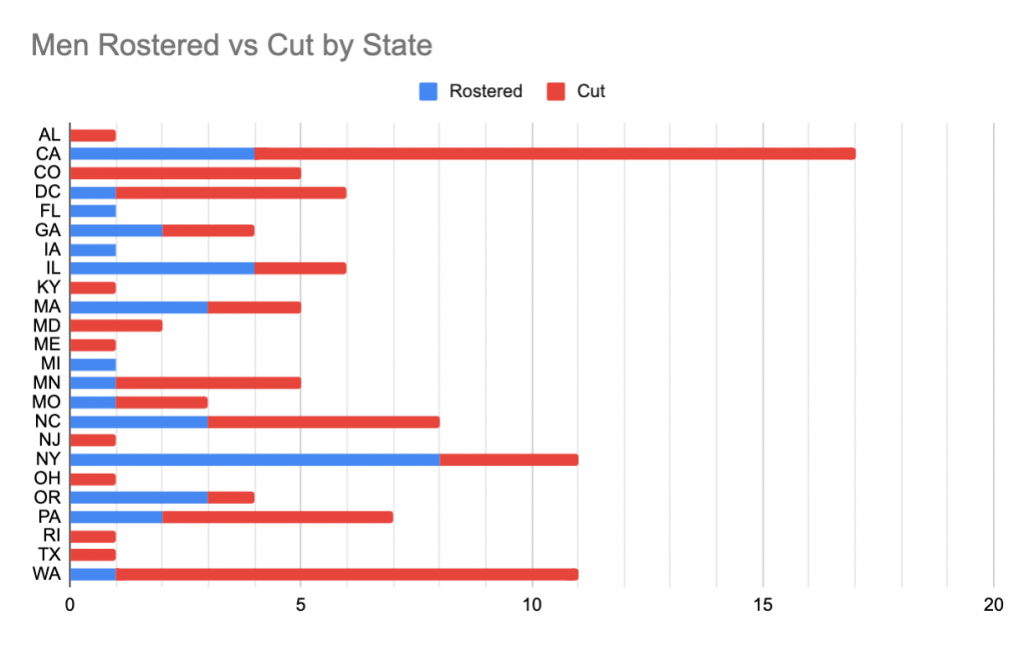
Notes:
- California was the big winner, with 14 players selected.
- Among male tryouts, Colorado was the only state with more than two players trying out that didn’t get represented on the final roster.
What are the region-by-region breakdowns for the rosters?
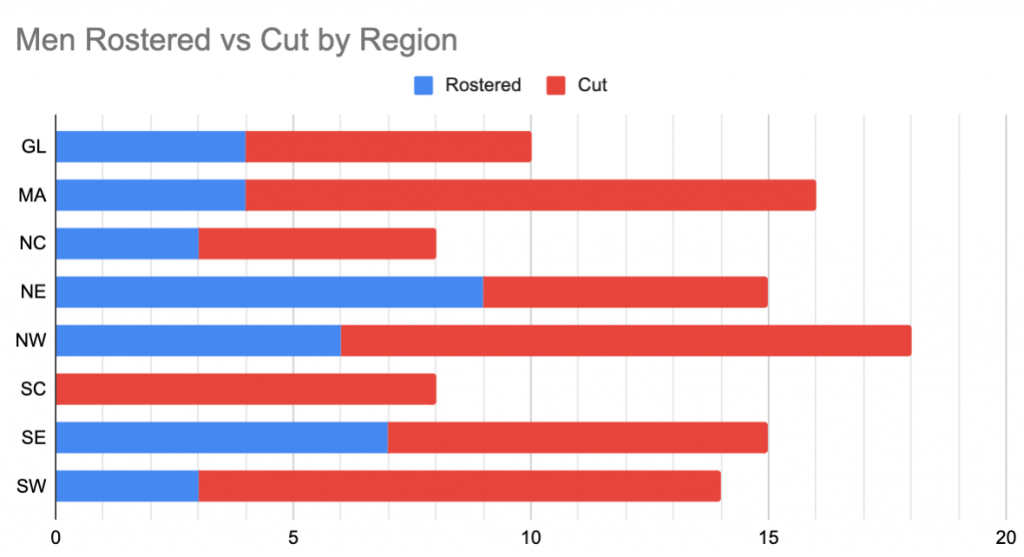
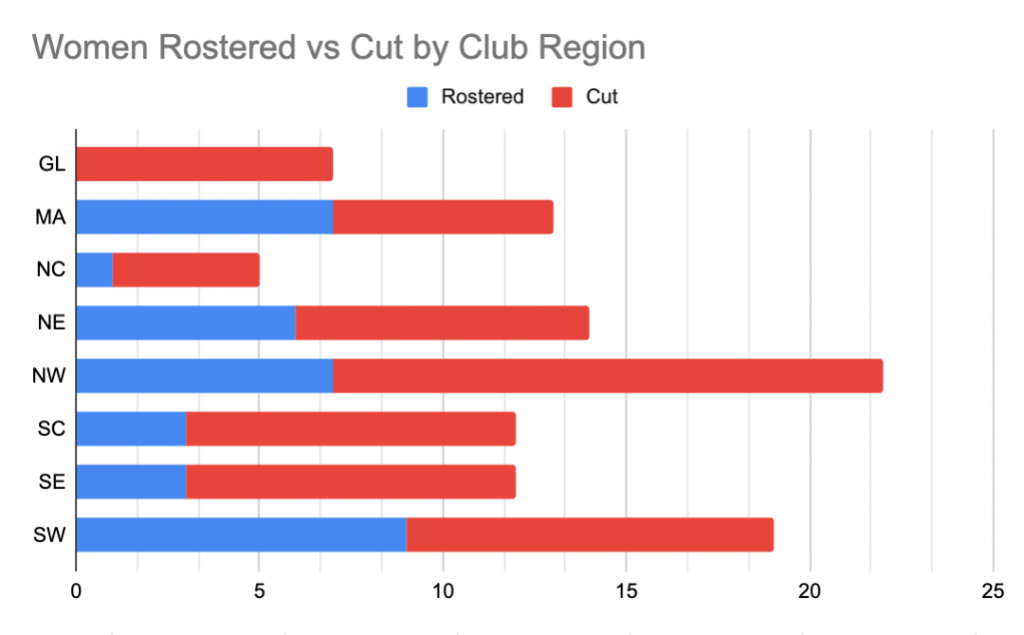
Notes:
- A huge dropoff this year for the Southwest Men’s region and a big uptick for the Northeast, showing the shift in the power balance between PoNY and Revolver.
- The South Central men’s and Great Lakes women’s were the only regions not to be represented.
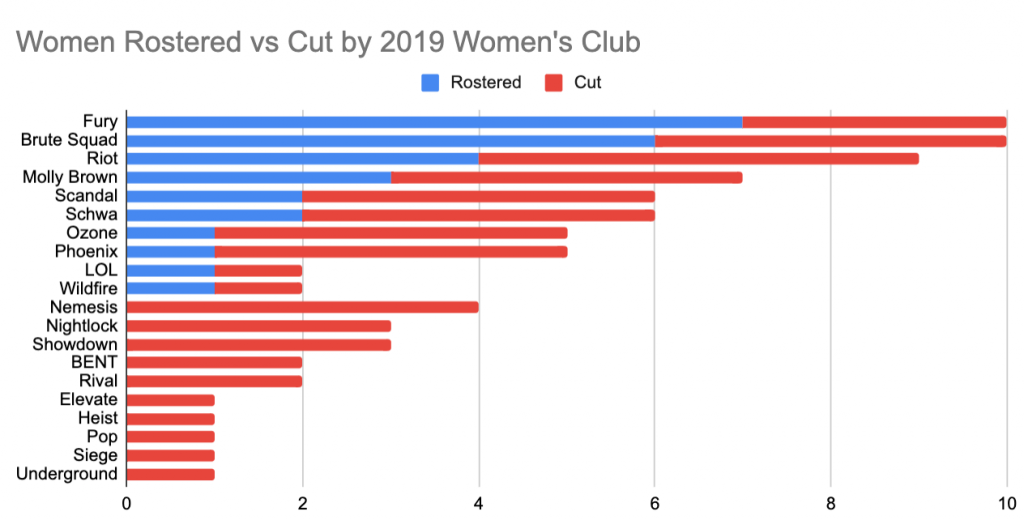
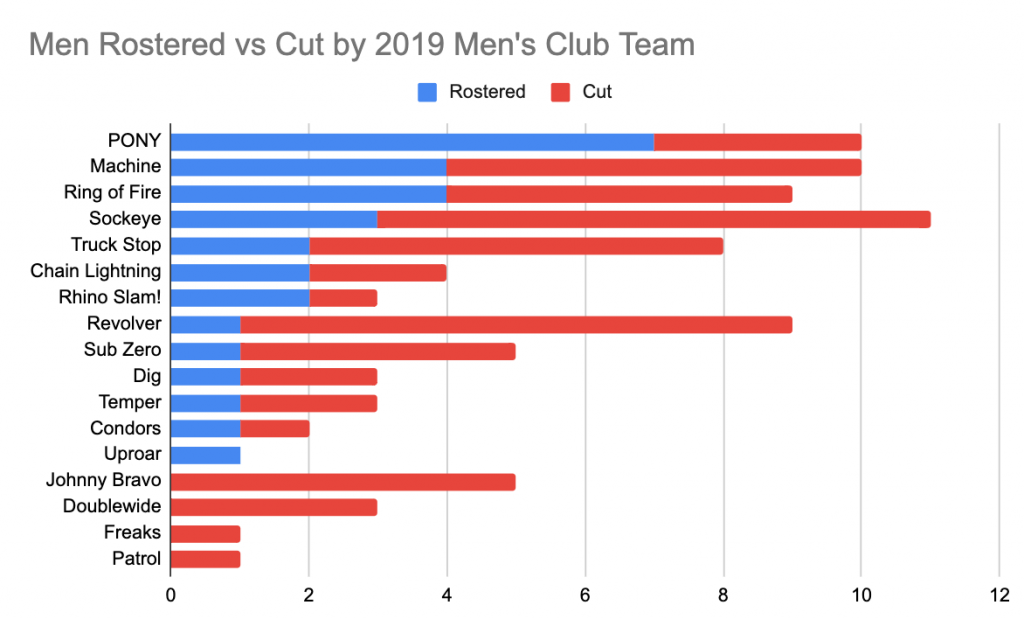
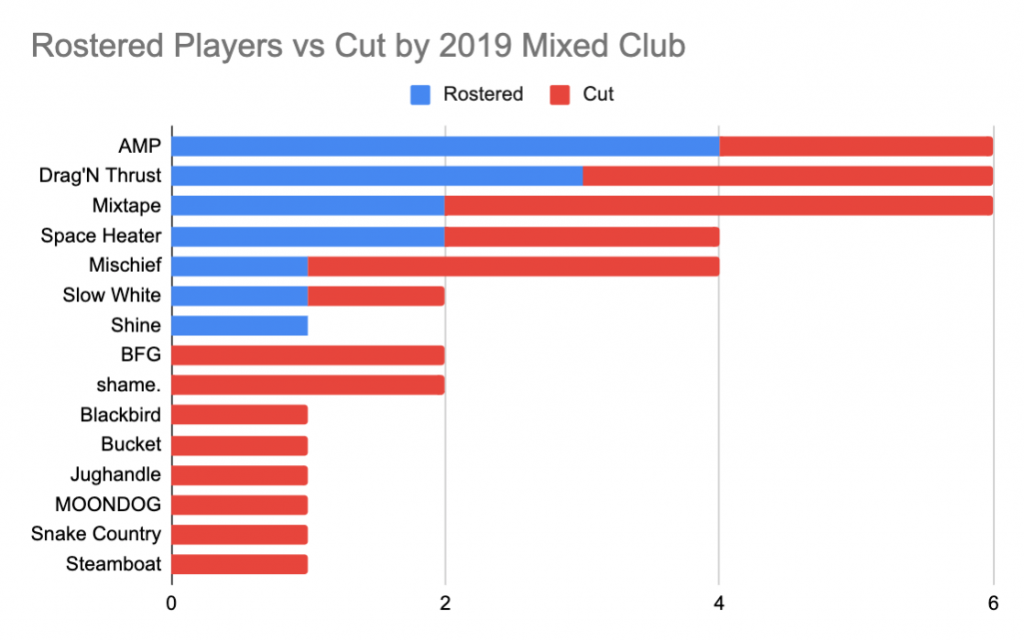
What is the overall club team representation?
What else do you notice in the roster selections?