December 18, 2012 by Sean Childers in Analysis with 5 comments

This is the second article in a series on player and team statistics from the NexGen tour. Read more in Ultiworld’s first statistical project, The Statistics Of NexGen.
Lou Burruss wrote an excellent article a month ago that sought to unpack the statistical concepts we sometimes vaguely refer to as “possessions.” Some of the ideas are team-specific while others have player-level applications, but all of them can be applied to NexGen.
This article first applies some of Burruss’ concepts of possession to the data we generated in our NexGen stats project. It also argues for and introduces some new measurements, especially at the player-stat level as we are about to launch our player stat pages. I end by introducing a conceptual framework for thinking about possessions and Ultimate games generally.
Average Offensive Possessions per Goal (“Efficiency” to Burruss):1
Burruss writes that climbing the competitive Ultimate ladder is clearly reflected in an increase in this variable: You can win at the lower levels by turning 40% of your offensive possessions into goals (2.5 average offensive possessions per goal) while the highest level requires something closer to 60%. It’s easy to understand this variable on a team level and here are the NexGen numbers:
| Type | Average Offensive Possessions Per Goal |
|---|---|
| Median | 1.8 |
| Minimum | 1.33 (Furious George) |
| Maximum | 3.22 (Johnny Bravo) |
Interestingly, the 1.8 NexGen average figure2corresponds to roughly a 55% rate, just between Burruss’ estimation of what it takes to win in college men vs. elite club. We can also apply this concept at the player-level by only looking at offensive possessions when any one player was on the field.
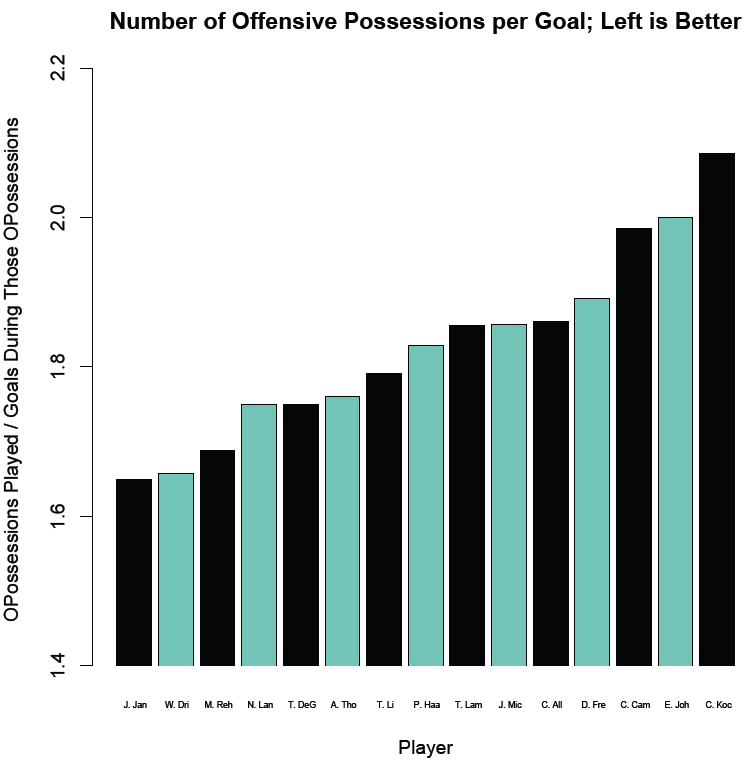
This concept and graph essentially adopts a similar concept to plus-minus by looking at the times that each player was on the field, calculating the number of offensive possessions during those points, and calculating the number of goals during those points. The only player whose value goes above 2.0 is Kocher (suggesting that, when he was on the field, NexGen was scoring on less than 50% of their possessions — below college-level, according to Burruss). Five NexGen players have ratios 1.65 or under (exceeding the 60% efficiency needed at the elite club level, by Burruss’ estimation).
I’m not personally sold on the idea of terming this “efficiency,” though. The chief problem is that it’s not clear that all failed offensive possessions should be treated equally: We might be more okay with our DLine turning it over at a higher rate than our OLine. The easy conceptual move is to then say “efficiency conditional on X”: Let’s compare our team’s efficiency conditional on the game’s wind conditions, conditional on which line was on the field, or conditional on the strength of the opponent.
But the real problem is that field position and yards are hugely important and seem to correspond to any intuitive notion of efficiency. Turnovers in your own endzone are substantially worse than a turn in your opponents’. But this metric treats both types of turnovers as equally devastating to your rate.3
This is why our ongoing efforts to develop player offensive and defensive efficiency ratings incorporate yardage and more intuitively map to “efficiency” as it is understood in other sports. A better term might be “offensive conversion rate,” but this is a bit ambiguous to the extent that it could refer to either a team’s OLine’s success (as opposed to DLine) or to the team’s overall success (when it finds itself on offense).
Completion Percentage or Retention Rate:
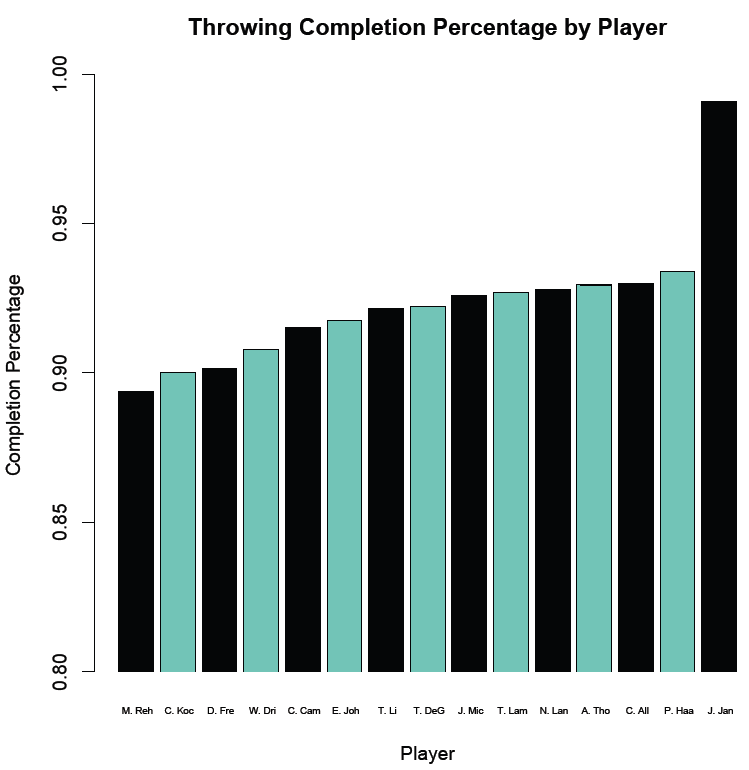
Remember that NexGen posted a 92.4% completion percentage in the games we recorded. The graph below shows the completion percentages for each player:
Graph Note: A comment on Jacob Janin’s completion percentage is in this footnote.4
I’m not sure that I agree with Burruss’ classification that any retention below 90% is “abysmal.” If NexGen is beating some of the best teams in the country with a retention of around 92%, and those teams were completing passes 91% of the time, then completion percentages in the low 90s (or even a bit below) seem like viable winning strategies. To echo Burruss’ point though, just because NexGen won with completion at 92% doesn’t mean your team will, because completions are rarely equal in value.
We don’t know enough yet, statistically, to say much more about this variable. But another thing to remember is that good teams will sport completion percentages that are higher when measured over the course of a season, because some of those games include weaker opponents. Thus, completion percentages in the 85-90% range in games between evenly matched teams may not be evidence of either team’s mediocrity.
Percent Points Won (“Conversion” to Burruss):5
This is the best metric for measuring team performance because, as I mentioned in this earlier article on NexGen, scoring margin is the most powerful predictor of future team success in sports.6
The problem with breaking this down at the player-level is the basic problem with plus-minus data: Everyone on the field gets credit for what might have been a few players’ contributions. A further consideration in Ultimate is that OLine players start points with a higher baseline expectation about the odds of winning that point than DLine players. There are ways around these problems, such as calculating different OLine and DLine plus-minus figures (Leaguevine does this) or looking at how often players play together. We’ll have more in-depth plus-minus calculations and an accompanying article in the future.
Why Rates Are Really Important—Except Not Really for NexGen
The most damning critique of the traditional “goals-assists-D’s” summation of Ultimate statistics is that it captures only a small part of the successful things that good players do. But another big problem is that these numbers are rarely adjusted for playing time even when they probably should be. Scoring ten goals in fifteen points played is amazing; scoring ten goals in 100 points is less so.
Basketball analysts have pushed rates like “per 36 minutes” and “per 40 minutes” into the mainstream discussion. The idea is that substitutes should have their things like their scoring impact evaluated in light of what they would do with more playing time. The practical impact, which applies to Ultimate as much as it does to basketball, is that coaches and captains might look to reserves that have solid ratable numbers as ideal candidates for increased playing time. Calculating these rates is easy using our program and others, like Ultiapps, which record both events and players on the field.
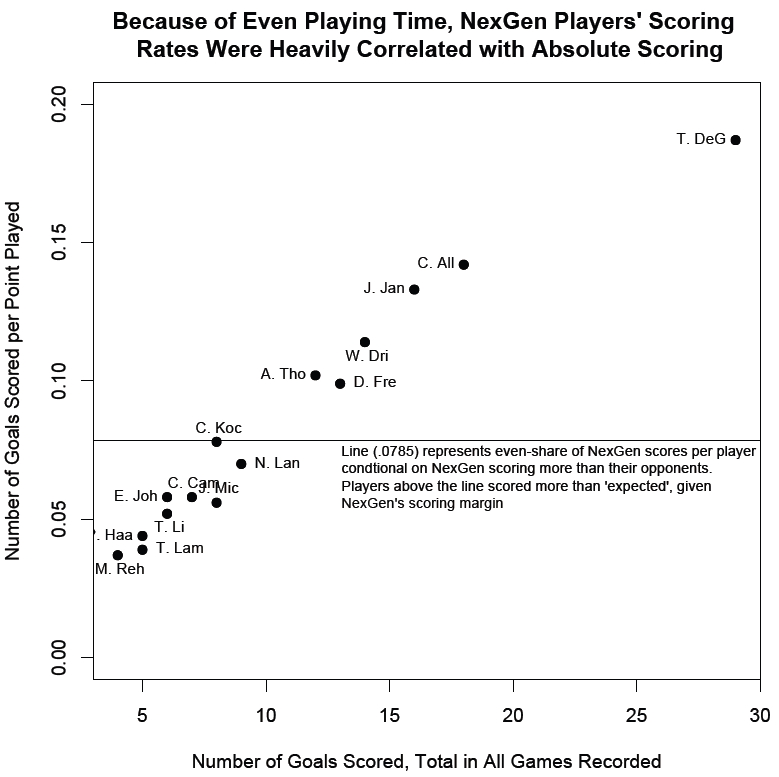
All of our player statistics pages will include both absolute figures and rates. What’s interesting for NexGen is that there is very little difference because these guys played a very similar numbers of points. The total goals scored compared to goals scored per point played gives a pretty good indication of this; the graph also gives a nice visual representation of Tyler DeGirolamo’s dominance. That guy scored goals twice as often as we might expect going into the series, and at a much greater rate than anyone else on the bus.
How Else Should We Think About “Possessions?”
Possession is an important component part of a complete conceptual understanding of putting Ultimate “on paper” and understanding it statistically. The problem, as Burruss notes, is that possession is such a malleable term that it can come to mean so many different things. For example, “Player X possess the disc well” maybe suggests a player with a high-completion percentage. “Her team plays possession Ultimate” might suggest a team that throws and completes a lot of (presumably low risk) passes.
But I think it’s most important to capture the term possession to first mean a unit of measurement in an Ultimate game, similar to its use in football or basketball. I would encourage the “evolution” of the term possession, as Burruss puts it, to proceed in this direction. Viewed as such a unit, Ultimate is an alternating-possession game, both within and across points; except for the mirror, you will never play two offensive or defensive possessions in a row. And “a possession” is a unit that may take place multiple times within a given point (each point in a game has the following number of possessions: 1 + number of combined turnovers). For any given team, each possession is either an offensive possession or a defensive possession and either ends in a score or ends in a turnover. Finally, throws, plays, movements of the disc, and other events take place within one single possession. When we continue to talk about possession, I think this should be the default starting point for what we mean.
Thanks to Nick Judson for pointing me in the direction of the Burruss piece. And continued thanks to Ian Guerin, Wesley Cronk, Kahyee Fong, Jeremy Weiss, and NexGen.
Formally, this is either goals scored/offensive possession or the inverse, the number of offensive possessions / goals. ↩
The average is formally the total number of offensive possessions in the games we coded divided by total number of goals. The median, min, and max values look to individual games; the median is thus representative of the typical NexGen performance on this measure. ↩
Burruss notes this problem towards the end of his article when discussing differences between team playing styles. ↩
The breakdown of completion percentages looks relatively even on NexGen, with the huge exception of Jacob Janin. Janin has one incompletion listed in our database out of about 100 passes. Naturally, we were skeptical. First, we remembered that the NexGen tour at one point talked about an incredible string of completions he had in a row. Second, we looked to the NexGen LeagueVine stat page. As you can see, there are a lot of games where his retention rate is 100% (We’re not sure what turns means, believe it or not, but we’re pretty sure it doesn’t correspond to our notion of a throwing turnover given the entries in retention). The NexGen page also gave us a hint as to what happened: Most of Janin’s turns may have been in the Southpaw game, which we didn’t code because the camera angle was not ideal for our yardage measurement style. Finally, we randomly picked a sample of 30 Janin throws from our database and re-checked the videos to ensure that they were completions. All of them were. The 99% completion rate is thus probably some combination of a very efficient thrower, a small sample size, a skewed sample size (if Janin’s incompletions tend to bunch together, and we missed that bunch because of Southpaw, then this is a misleading metric), and, possibly, some error in our beta coding procedures or application. ↩
Formally goals scored/points played. ↩
Taking into account opponent strength will be a necessary future adjustment. ↩


