Do we want games to be played to 15? A look at the impact of reducing round times at Club Nationals back to 2004.
September 29, 2017 by Guest Author in Analysis with 11 comments
This article, written by Craig Poeppelman, was originally published on his Medium blog, The Flip. Check it out for more data-driven analysis of ultimate.
I had a drink a few months ago with a friend who was a stalwart in the club game back in the 1990s. I asked him what he thought of the club game today compared to a few decades ago. First, he said no one plays defense any more. Ok, fair enough. He’d fit right in with Shaq and Barkley on a TNT halftime show.
Second, he said that games are too short today. Back in his early days, they played games to 19 and 21 and every point was played uphill and upwind. While those days are a distant memory, it got me thinking about how many games at Nationals even make it to 15 any more. I’ve played at Club Nationals or followed as a spectator back to 2009. It seems that more and more games end with a winning score of 14, 13, or an even lower score. So I decided to dig into the numbers.
Background
USA Ultimate made some major changes to the Club Nationals format starting in 2013. While a lot of attention, rightfully so, was placed on the format of power pools versus a 16-team bracket, another big change was reducing round times to just 1 hour and 45 minutes.
Data
I looked at round times at Nationals by year back to 2004. To the best of my knowledge and research, here is what I found.
- 2004–2010: 2 hour rounds
- 2011–2012: 2h 20min rounds
- 2013–2016: 1h 45min rounds
Next, I looked at the breakdown of winning scores by year at Nationals. Data are from the USAU website and Score Reporter. Note that I did not include any consolation games. Only pool play games, power pool, lower pool, and championship bracket games were considered.
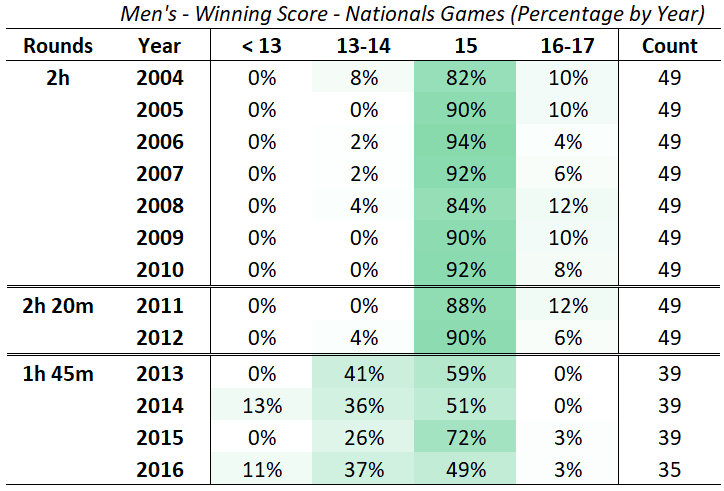
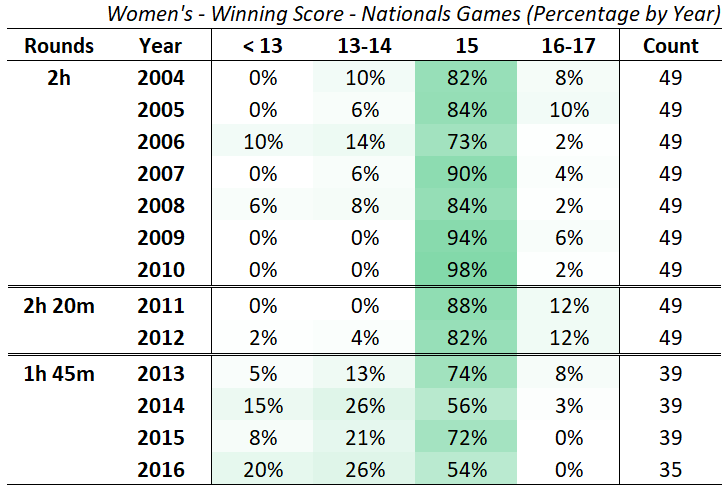
One caveat I considered is that there may be more parity at Nationals recently. The new format may lead teams to push every game and keep scores closer, thereby increasing the probability of a game being capped. Also, teams may be more balanced. To factor this in, I broke down the winning scores by year for games that had a margin of victory of four or less. Still, the same trend is apparent. Close games just don’t get to 15 as often as they used to.
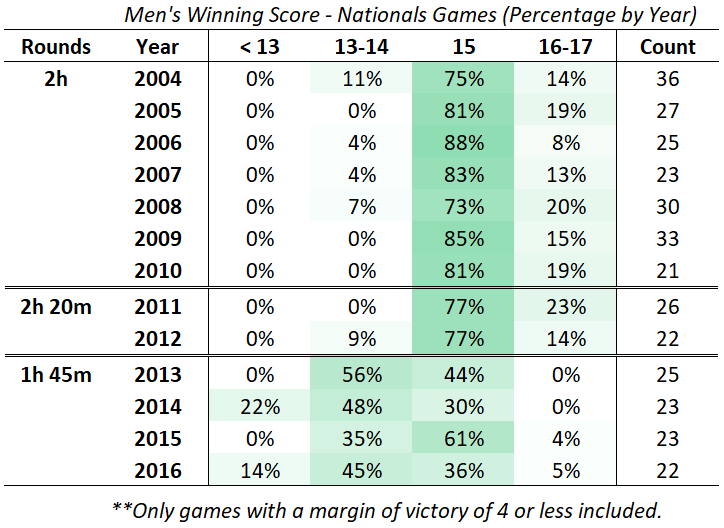
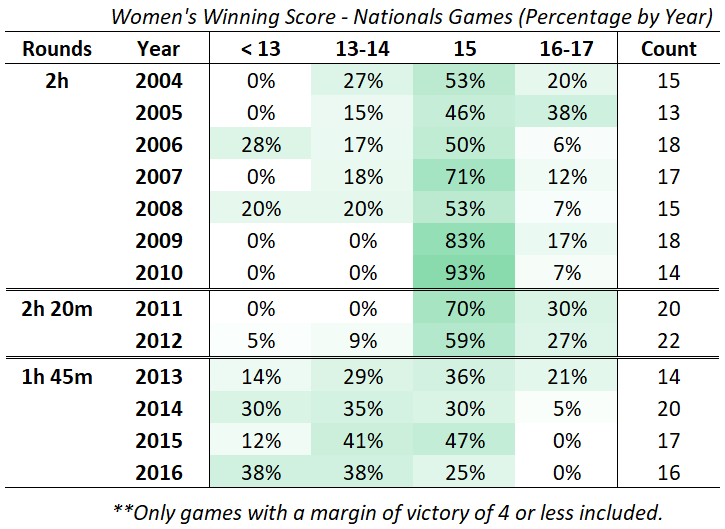
A significant portion of games at Nationals are not reaching a winning score of 15 any more. This makes sense based on the reduced round times, but this creates effects on game outcomes. Shorter games create greater volatility in the outcome. Therefore, it’s more likely that a team can be upset with reduced round times.
Weather
For a sanity check, I took a look at weather data for all Nationals dating back to 2004. Looking at 2012, wind was a huge factor, which impacted how long points and games were. How about all the other years? I scraped historical weather data from Weather Underground for all Nationals rounds dating back to 2004. The weather data were measured at the nearest airport to where the tournament was played. Hourly weather data was used and matched to the round time each day.
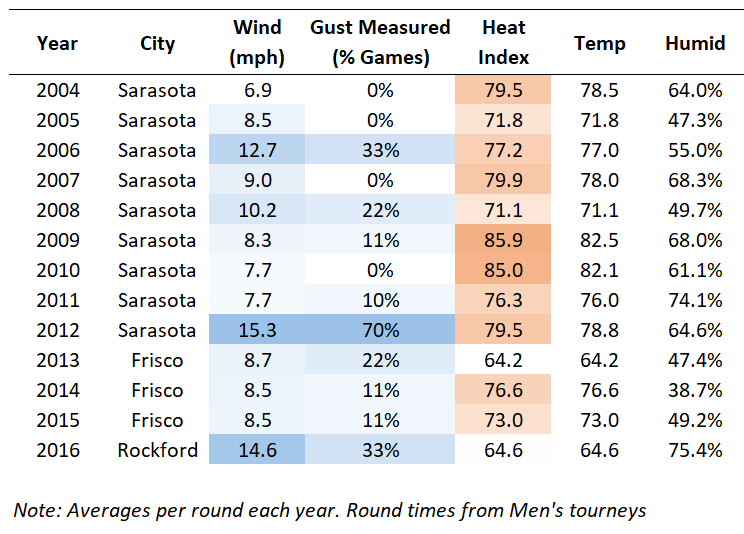
From this data, we can see that 2012, 2016, and 2006 all had pretty bad wind conditions. When comparing this weather data to the tables above, there is a slight correlation with heavy wind conditions and more games being capped. This correlation is somewhat stronger in the women’s division. Overall the changes in round times appear to be much more important on the amount of games that are capped.
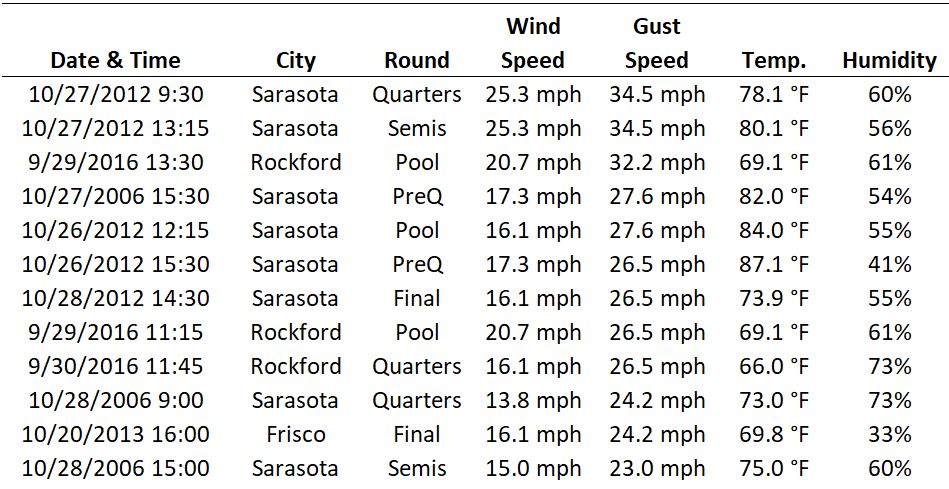
And for those interested, here are the rounds with the worst wind conditions as measured by wind gust speed.
Round Times and Capped Games — Simulation Data
I also wanted to simulate games to see if the empirical data match what we would expect. These simulated games are by no means a perfect comparison to actual Nationals results. But I believe they are valuable in measuring the impact of round times with respect to how many games are capped.
I simulated games with even opponents each scoring an expected 70% of their offensive points. For the time distribution per point, I used the data fit I gathered from the WUGC 2016 Men’s data. I used a lognormal distribution with a mean of 4.75 and standard deviation of 0.75 for the time per point (seconds). I added 60 seconds between points and 10 minutes for halftime.
I ran 100,000 game simulations for 1h 45 min rounds, 2h rounds, and 2h 20m rounds. The simulations included soft cap and hard cap rules. The data below capture all the games where the margin of victory was four or less (~3/4 of the simulated games).
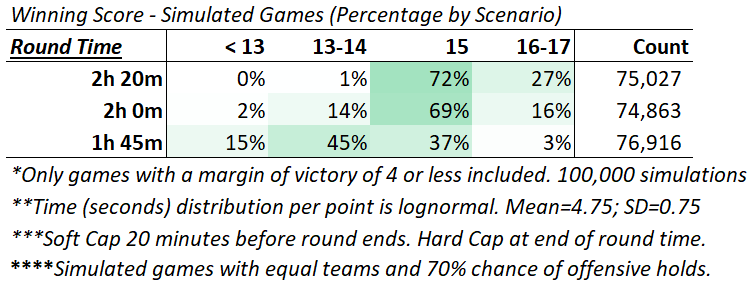
The data of the simulated games seem comparable, although they are not a perfect fit with the empirical data from Nationals. On a separate note, it also gives some credibility to the time distribution fit from WUGC 2016 and matching it to Club Nationals games.
Takeaways
Round Times
In my view, one of the great traits of ultimate is that teams have to finish a game to win instead of just running out the clock. This is still somewhat true at Club Nationals, as the hard cap has been removed for semis and finals. Regardless, the clock has a huge impact on games especially when round times are shortened. Instead of just playing to 15, teams are considering ways to speed up or slow down the game to give them an advantage based on the current score. This is just part of the game now and necessary due to field constraints and media coverage.
For Nationals, though, I wish round times would move back to two hours. Shorter games increase the variability in the outcome, thereby increasing the chances for upsets as opposed to the best team advancing. Do we want more upsets for drama or do we want a tournament that gives the title to the best team as often as possible? I say the latter. Let’s make Nationals games longer.1
In-Game Strategy
Another way to look at these numbers is through the lens of game strategy. If you’re a coach or captain at Nationals, you should be coaching with the expectation that a close game likely will be won with a score lower than 15. In addition, with shorter games, this enhances the benefit of winning the flip and receiving (see more on this advantage in this article).
Also, one could look at how many points to plan for in a given game. For the individual calling lines, there is always a tension regarding how many points to give to various players each game. Substitutions can only be made between points (removing injuries from the equation), so one should be optimizing line calling based on the number of substitution opportunities there are. Here is a look at the number of points per game at Nationals. I only included games with a margin of victory of 4 or less because subbing strategies are less important in games with a higher margin of victory.
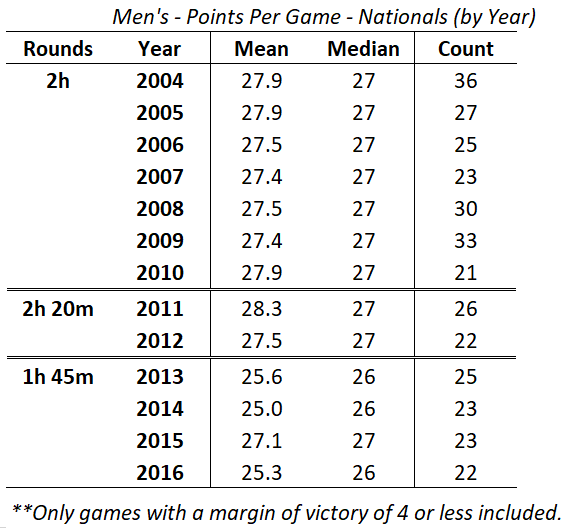
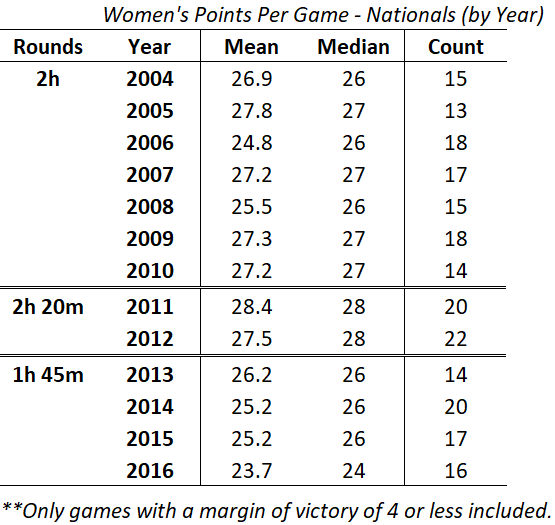
From the table, a team should prepare for ~27 points per game in a close contest when round times are two hours or more. This estimate reduces to ~25 points per game with round times of 1 hour and 45 minutes.
I don’t think these are groundbreaking data, but they are another piece of knowledge in the toolbox for team leaders to use.
Yeah, yeah, I know it’s all about field space and media coverage. I can still dream though. ↩