Plus Kauffman puts an exclamation point on the regular season.
June 5, 2026 by Paul Würtztack in Analysis
Welcome to Better Box Score Metrics, our analytics column focused primarily on semi-pro statistics and discovering new ways to use data to explore ultimate. It is anchored by EDGE, which we can summarize as converting goals, assists, blocks, turnovers, and yards gained into one metric, while accounting for the scoring and turnover environment.
The WUL’s regular season concluded this past weekend, but we’ll save our awards-podium chatter until after Championship Weekend, although Jamie Kauffman may have removed any MVP suspense with yet another huge game.
Instead, as necessary counter-programming to BBSM’s regular focus on top individual stats, our Championship Weekend Preview will focus on team depth.
Figure 1 shows Box and Whisker plots for the eight WUL teams based on a player’s per-game-played EDGE-O scores. As a quick review, the colored boxes represent the “interquartile range,” the middle 50 percent of players on a team (roughly players 7-18 as ranked by this metric), while the whiskers extend to the furthest data point within 1.5 x the IQR. Single dots are data points more than 1.5*IQR from the nearest box edge. Inside the box, the “x” is the mean and the dark line is the median.
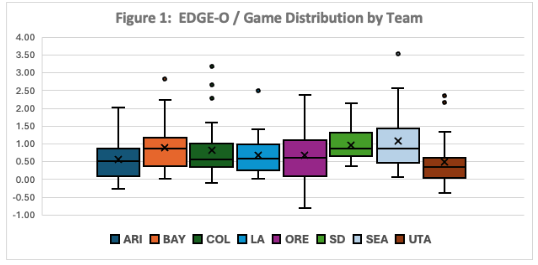
Not surprisingly, since the sum of EDGE-O approximates team scoring, the four teams with the highest mean EDGE-O per game are going to Championship Weekend: Bay Area, Colorado, San Diego, and Seattle. Among the four, San Diego’s plot stands out: it has the narrowest IQR, not a single player lies outside its whiskers, and most notably, its low whisker is 0.37, much higher than any other team’s. All of this points to a high level of offensive distribution among the team and the absence of “weak links.”
However, some of the EDGE-O results reflect San Diego’s tactics: along with Arizona and LA, San Diego has run its lines in steady rotation rather than having designated O- and D-lines (the “Player Roles” figures on the “Team Pages” of the WUL Stats Hub illustrate the differences). In such a rotation, it is only natural that offensive output is going to be more widely distributed than on teams that run O-lines.
But there is a difference between balance and depth, and the coaching decision as to whether to run a regular rotation can hinge on whether the “load management” advantages of a rotation outweigh the tradeoff of running the teams’ best offensive players proportionally fewer times on offense. For Seattle Tempest in 2023 or this past summer’s U.S. World Games team, banking on rotation worked out.
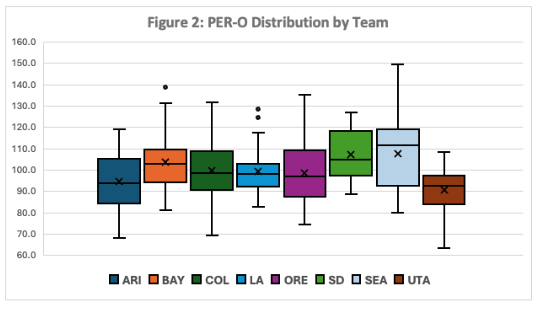
However, rotational lines did not take Arizona or L.A. to Championship Weekend this year, so how else might we evaluate team depth? One option is to look at PER-O (offensive player efficiency ratings), which are independent of playing volume, unlike EDGE-O, and better isolate a player’s efficiency from team efficiency.
Figure 2 swaps in PER-O for EDGE-O, and one can see the rationale for San Diego’s rotations: the range between the most and least efficient player on Super Bloom is far narrower than any other team, such that the difference between slotting any player on an O-line vs the best 2-3 players is less than for other teams. It’s not clearly independent of team dynamics: being more rested between points could help elevate each player’s PER-O, but one can fairly well conclude that San Diego has the kind of depth that can make the system work.
But will it win? That’s not a given. Seattle’s mean and median PER-O is higher than San Diego’s, which could be a function of an easier schedule (the Southwest Division won the inter-division battle 6-2 over the Northwest Division), or a potential point of leverage by leaning on its top-end trio (Kauffman, Hsu, Manning) even more. For that matter, Bay Area and Colorado also have at least of pair of viable all-WUL 1st-teamers (see Table 3) that for one game can make depth-heads eat it.
But if San Diego does win, the “whisker bottom” will likely be the reason why.
WUL Week 12 Analytics
Without further ado, here are the regular four feature tables: the leaderboard and full-player tables for the week(s) and the leaderboard and full-player tables for the season.
Better Box Score Metrics: WUL Week 12 & A Look at League Depth is only available to Ultiworld Subscribers
Already have a subscription? Log in
Whether you visit Ultiworld for our reporting, our podcasts, or our video coverage, you can help us continue to provide high quality content with a subscription. By becoming a subscriber, not only do you receive benefits like exclusive articles and full article RSS feeds, you also help fund all of Ultiworld's coverage in general. We appreciate your support!