Tempest win another championship, on their unique terms
June 12, 2023 by Paul Würtztack in Analysis, Recap
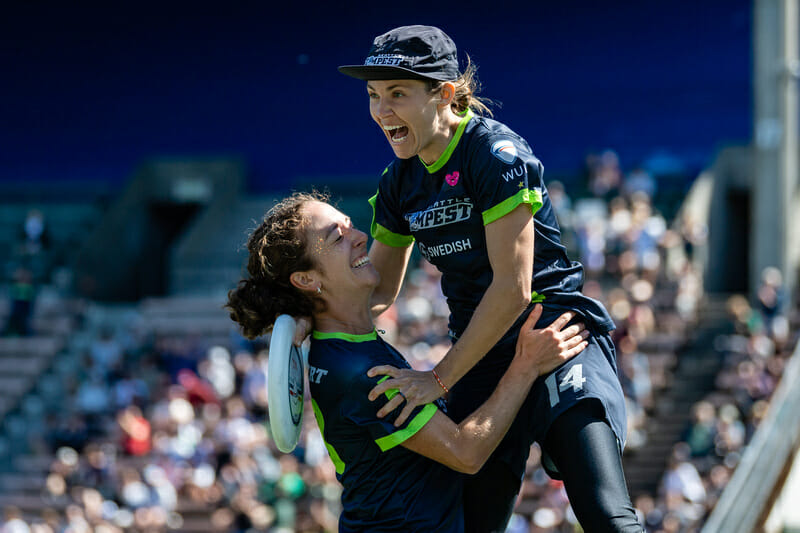
Dos Equis should sponsor the Seattle Tempest, for the Tempest are the most interesting team in the world (of semi-pro ultimate). It’s not that Seattle has won back-to-back WUL championships—they have a perfect counterpart in the AUDL for that—it’s how they win them.
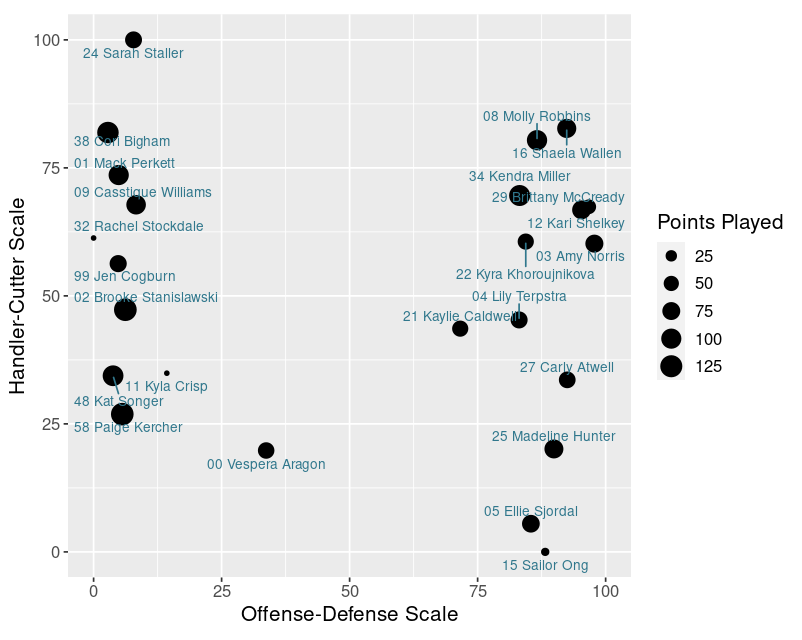
Let’s return to the WUL’s fabulous Stats Hub Team Page, where the “Player Role” visualizations that I pointed to at the beginning of the season tell a compelling story. Before we get to Seattle, let’s start with the Utah Wild, who finished fourth this year. In the chart below, the x-axis is the WUL’s Offense-Defense Scale (ODS), which shows the number of points one starts on D-line as a percentage of all points played.1 The y-axis shows the Handler-Cutter Scale (HCS), or receiving yardage as a percentage of one’s total yardage. For simplicity, we’ll just give each role a third of the y-axis: less than 33.3% (handler); 33.3-66.7% (hybrid); greater than 66.7% (cutter). The chart shows the Wild with firmly established O- and D-line roles, but a broad distribution of throwing/handling outcomes, slightly concentrated toward the middle.
Utah may have been the most O-line/D-line stratified team in the WUL, but not extremely so, and they have a lot of company in the AUDL. As an example, I’ve constructed the same chart for 2022’s undefeated New York Empire. They were even more rigid in their line assignments, with most every player pushed farther to the edges of the O-line/D-line scale.
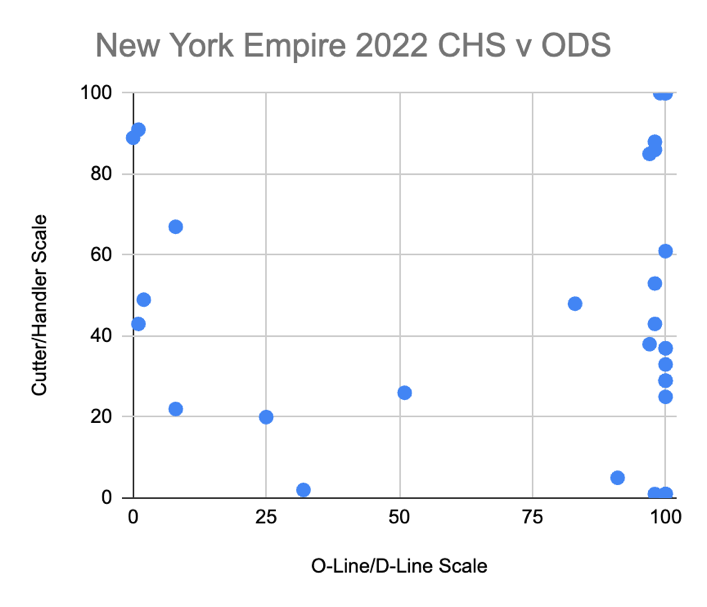
The Empire’s throwing and receiving distribution also resembles the Wild’s.2 These values seem typical of the league as a whole: in 2022, 78 percent of all AUDL players started more than 80 percent of their points on either O-line or D-line, while the handler-hybrid-cutter distribution was 23 percent handlers, 37 percent hybrids, and 40 percent cutters.
Now let’s look at Seattle. They are the complete opposite.
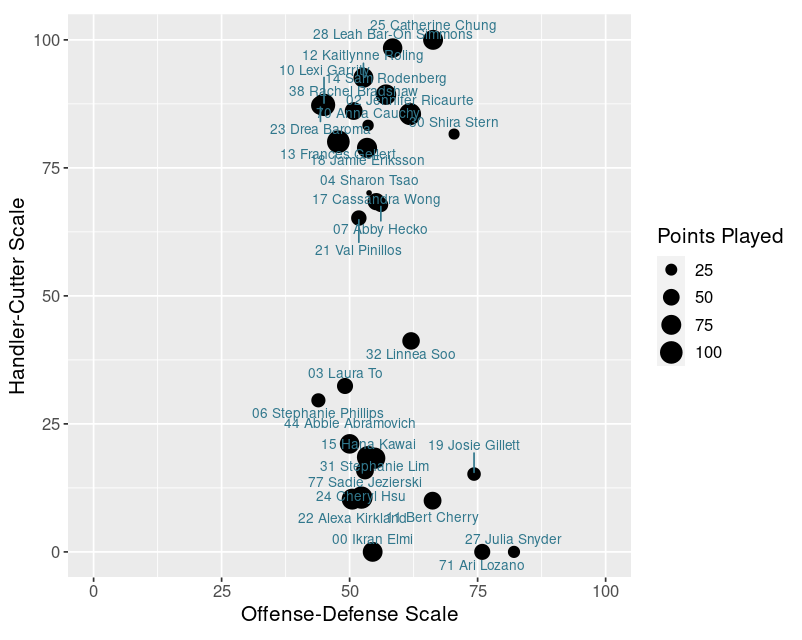
On Tempest, everyone plays about an equal number of O-line and D-line points. And it’s more equitable than that: the third dimension in the two WUL charts—Points Played—is misleading because it’s season totals, not per-game average, and therefore reflects the effect of missing games altogether. For any given game, “points played” is about equal for everyone. That is commitment to a philosophy.
Meanwhile, who needs hybrids? Only one player, Linnea Soo, falls in the HCS hybrid zone for Seattle. I can’t be sure this is as intentional as playing time, but 2022 Tempest looked very similar, so I’m willing to believe it is. I have no tactical analysis to make here, other than it’s clearly working.
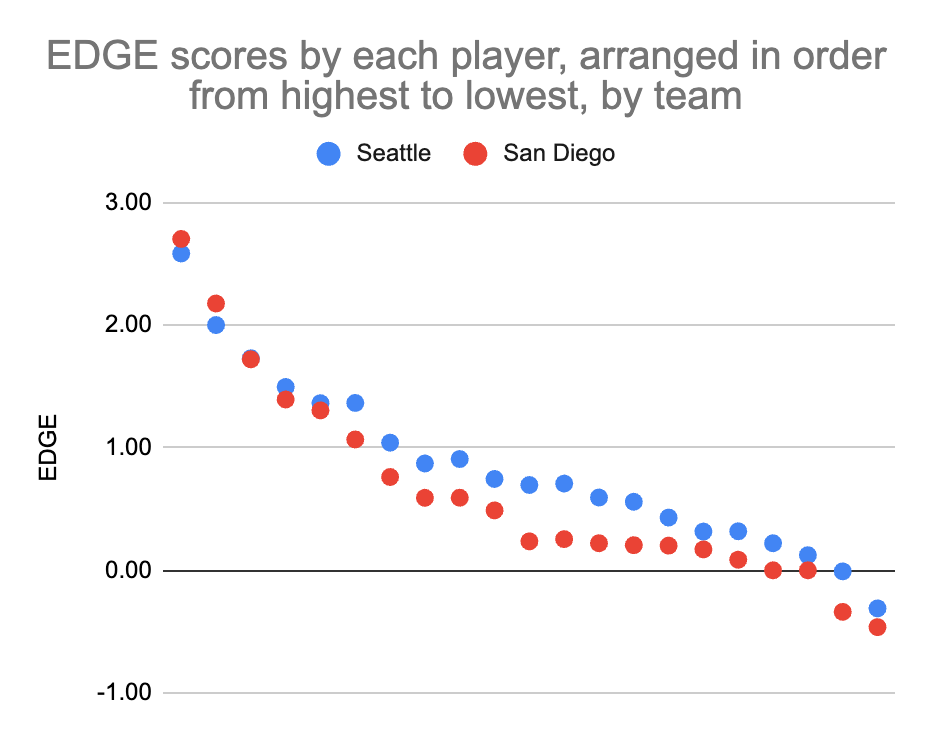
Seattle is also now the poster team for the BBSM adage: stars are compelling, but depth wins games. The following chart from the championship game shows the EDGE “goal equivalents” for each team arranged in order from highest to lowest for the players on the team. The top five players for each team approximately cancel each other out; it’s players 6-15 for Seattle who create the bulk of the winning scoring margin. As I’ve pointed out before, comparing the 8th highest EDGE scores for each team is a much better indicator of which team won the game than comparing the highest scores.
I’m pretty certain that such a chart for each of Seattle’s games these past two seasons would show the same pattern. Depth is undoubtedly the key to Seattle’s success, but the question is this, given their dedication to equal playing-time and line-assignments: are Tempest taking advantage of their depth or creating depth?
Snubbed? Not Really
It did not go without notice that the league’s finalists for each of its season-ending awards did not include a single Tempest player. Given the WUL’s criteria and the discussion above, it’s perhaps a little surprising, but not that surprising.
For the criteria, this is yet another thing the WUL does better than any other ultimate league. Accompanying the awards announcement was a clear description of how they were determined: regular season only, 5-game minimum threshold, and that a voting committee considered player’s statistical rankings for an award-specific suite of metrics and named exactly which metrics were used. Such transparency takes a lot of air out of “snubbed” controversies, and I think it’s great, particularly when the outcome of the three main awards—MVP: Helton; OPOTY: Kercher; DPOTY: Robbins—aligned exactly with my own MVP methodology.
In Seattle’s case, even though the metrics emphasized per-possession rate stats that would be more favorable to them then counting stats, it appears Seattle was balanced not only in its gameplan—with even playing time and line assignments—but also in its output, with no single player standing out this season in terms of productivity. For example, among qualifying players, Sam Rodenberg had the Tempest’s highest Offensive Impact Score, but it was only the 18th highest in the league.3 I assume Tempest view it as a badge of honor that they are once again carrying home the trophy and not one of their players was singled out for individual accolades.
Congrats to Seattle then, as pure of an embodiment of “team effort” as one can find in sports today.
It’s therefore a little off-key to point out that Jamie Eriksson had a whale of a final. On just 8 points played, Eriksson had 296 yards, 4 scores, and 1 turn. Dena Elimelech had a lightly larger total EDGE, but she also played more than twice as many points and had four times as many possessions. It’s also completely true to Tempest form that they had by far the fewest of the top 20 EDGE scores from Championship Weekend—just two, and the second was 20th (Rodenberg in the final). Owning the incongruity of featuring individual stats, EDGE results for all of Championship Weekend are below.
| Name | # | Team | Opponent | Gm | OPP | DPP | POS | OppPOS | G | A | ThY | RecY | Y | ThEr | RecEr | TRN | B | GmSE | EDGE-O | EDGE-B | EDGE |
|---|---|---|---|---|---|---|---|---|---|---|---|---|---|---|---|---|---|---|---|---|---|
| Alex Diaz | 2 | SD | UT | SF1 | 12 | 2 | 24 | 13 | 3 | 3 | 57 | 213 | 270 | 1 | 1 | 2 | 3 | 0.38 | 2.35 | 1.15 | 3.50 |
| Rebeca Ellis | 9 | SD | UT | SF1 | 10 | 8 | 27 | 21 | 3 | 2 | 209 | 69 | 278 | 2.5 | 0 | 2.5 | 3 | 0.38 | 2.00 | 1.15 | 3.15 |
| Kaylie Caldwell | 21 | UT | SD | SF1 | 15 | 0 | 27 | 17 | 3 | 0 | 174 | 209 | 383 | 2 | 0 | 2 | 1 | 0.38 | 2.50 | 0.38 | 2.88 |
| Dena Elimelech | 46 | SD | SE | F | 10 | 11 | 44 | 44 | 5 | 2 | 111 | 240 | 351 | 6.5 | 1.5 | 8 | 3 | 0.22 | 2.09 | 0.67 | 2.76 |
| Jamie Eriksson | 18 | SE | SD | F | 3 | 5 | 10 | 11 | 1 | 3 | 82 | 214 | 296 | 0 | 1 | 1 | 0 | 0.23 | 2.65 | 0.00 | 2.65 |
| Dena Elimelech | 46 | SD | UT | SF1 | 10 | 10 | 26 | 24 | 3 | 0 | 65 | 116 | 181 | 0 | 0 | 0 | 2 | 0.38 | 1.87 | 0.77 | 2.64 |
| Shaela Wallen | 16 | UT | SD | SF1 | 3 | 12 | 11 | 22 | 1 | 1 | 55 | 95 | 150 | 0 | 0 | 0 | 3 | 0.38 | 1.45 | 1.15 | 2.60 |
| Kara Hammer | 44 | SF | UT | 3rd | 11 | 0 | 25 | 14 | 1 | 4 | 111 | 207 | 318 | 4.5 | 0 | 4.5 | 2 | 0.27 | 2.04 | 0.53 | 2.57 |
| Paige Kercher | 58 | UT | SF | 3rd | 11 | 1 | 25 | 14 | 0 | 2 | 360 | 48 | 408 | 2.5 | 0 | 2.5 | 0 | 0.27 | 2.56 | 0.00 | 2.56 |
| Mara Saltzman | 11 | SF | UT | 3rd | 7 | 3 | 19 | 10 | 4 | 1 | 71 | 166 | 237 | 1 | 0.5 | 1.5 | 1 | 0.27 | 2.28 | 0.27 | 2.55 |
| Brooke Stanislawski | 2 | UT | SF | 3rd | 10 | 1 | 19 | 11 | 2 | 2 | 170 | 108 | 278 | 1 | 0 | 1 | 0 | 0.27 | 2.48 | 0.00 | 2.48 |
| Kristen Pojunis | 4 | SD | UT | SF1 | 5 | 15 | 24 | 30 | 2 | 2 | 58 | 151 | 209 | 3 | 0.5 | 3.5 | 4 | 0.38 | 0.94 | 1.53 | 2.47 |
| Paige Kercher | 58 | UT | SD | SF1 | 14 | 1 | 23 | 12 | 1 | 1 | 280 | 119 | 399 | 2 | 0 | 2 | 0 | 0.38 | 2.40 | 0.00 | 2.40 |
| Kaela Helton | 5 | SD | SE | F | 8 | 11 | 39 | 41 | 0 | 2 | 133 | 151 | 284 | 4.5 | 0 | 4.5 | 4 | 0.22 | 1.36 | 0.90 | 2.26 |
| Gina Schumacher | 47 | SF | UT | 3rd | 6 | 0 | 12 | 6 | 2 | 2 | 106 | 137 | 243 | 1 | 0 | 1 | 0 | 0.27 | 2.24 | 0.00 | 2.24 |
| Kat Songer | 48 | UT | SF | 3rd | 11 | 0 | 29 | 19 | 1 | 2 | 201 | 164 | 365 | 2 | 1.5 | 3.5 | 0 | 0.27 | 2.21 | 0.00 | 2.21 |
| Eliza Pugh | 17 | SF | UT | 3rd | 11 | 3 | 29 | 16 | 2 | 2 | 204 | 126 | 330 | 4.5 | 0 | 4.5 | 1 | 0.27 | 1.91 | 0.27 | 2.18 |
| Theresa Zettner | 7 | SD | UT | SF1 | 5 | 6 | 15 | 15 | 1 | 2 | 71 | 91 | 162 | 1 | 0 | 1 | 2 | 0.38 | 1.36 | 0.77 | 2.13 |
| Cori Bigham | 38 | UT | SD | SF1 | 13 | 0 | 19 | 11 | 1 | 0 | 85 | 79 | 164 | 0 | 0 | 0 | 2 | 0.38 | 1.34 | 0.77 | 2.10 |
| Sam Rodenberg | 14 | SE | SD | F | 7 | 4 | 30 | 27 | 3 | 0 | 14 | 122 | 136 | 0 | 0 | 0 | 2 | 0.23 | 1.56 | 0.45 | 2.02 |
| Kaela Helton | 5 | SD | UT | SF1 | 1 | 8 | 11 | 12 | 0 | 3 | 160 | 93 | 253 | 0.5 | 0.5 | 1 | 0 | 0.38 | 1.99 | 0.00 | 1.99 |
| Linnea Soo | 32 | SE | SF | SF2 | 1 | 6 | 19 | 17 | 1 | 0 | 87 | 131 | 218 | 1 | 0 | 1 | 2 | 0.23 | 1.48 | 0.47 | 1.94 |
| Sadie Jezierski | 77 | SE | SF | SF2 | 4 | 4 | 17 | 15 | 0 | 3 | 264 | 25 | 289 | 3 | 0 | 3 | 0 | 0.23 | 1.92 | 0.00 | 1.92 |
| Pin-Wen Wang | 36 | SF | SE | SF2 | 3 | 2 | 10 | 12 | 1 | 1 | 120 | 128 | 248 | 1 | 0 | 1 | 0 | 0.22 | 1.91 | 0.00 | 1.91 |
| Avery Jones | 11 | SD | SE | F | 6 | 8 | 22 | 22 | 0 | 1 | 290 | 45 | 335 | 3 | 1 | 4 | 1 | 0.22 | 1.62 | 0.22 | 1.84 |
| Molly Robbins | 8 | UT | SD | SF1 | 4 | 12 | 14 | 22 | 1 | 2 | 41 | 129 | 170 | 0 | 0 | 0 | 0 | 0.38 | 1.80 | 0.00 | 1.80 |
| Kaitlynne Roling | 12 | SE | SF | SF2 | 1 | 6 | 17 | 15 | 1 | 1 | -32 | 248 | 216 | 1 | 0.5 | 1.5 | 1 | 0.23 | 1.56 | 0.23 | 1.79 |
| Malina Wiebe | 10 | SF | SE | SF2 | 5 | 3 | 13 | 9 | 3 | 0 | 19 | 149 | 168 | 1 | 0 | 1 | 1 | 0.22 | 1.56 | 0.22 | 1.78 |
| Meeri Chang | 21 | SF | SE | SF2 | 5 | 5 | 17 | 21 | 0 | 2 | 225 | 19 | 244 | 2 | 0.5 | 2.5 | 1 | 0.22 | 1.55 | 0.22 | 1.77 |
| Amanda Meroux | 33 | SF | UT | 3rd | 11 | 3 | 29 | 16 | 1 | 0 | 74 | 129 | 203 | 0 | 0.5 | 0.5 | 1 | 0.27 | 1.47 | 0.27 | 1.74 |
| Drea Baroma | 23 | SE | SD | F | 3 | 5 | 10 | 11 | 2 | 1 | 13 | 116 | 129 | 0 | 0 | 0 | 1 | 0.23 | 1.52 | 0.23 | 1.74 |
| Julia Salvacion | 48 | SD | UT | SF1 | 8 | 6 | 17 | 14 | 1 | 2 | 28 | 129 | 157 | 0 | 0 | 0 | 0 | 0.38 | 1.71 | 0.00 | 1.71 |
| Sam Rodenberg | 14 | SE | SF | SF2 | 4 | 4 | 19 | 17 | 2 | 1 | -7 | 176 | 169 | 1.5 | 0 | 1.5 | 1 | 0.23 | 1.44 | 0.23 | 1.68 |
| Hana Kawai | 15 | SE | SF | SF2 | 4 | 4 | 17 | 15 | 1 | 1 | 189 | 60 | 249 | 0 | 2 | 2 | 0 | 0.23 | 1.67 | 0.00 | 1.67 |
| Kari Shelkey | 12 | UT | SD | SF1 | 3 | 10 | 10 | 17 | 1 | 1 | 21 | 70 | 91 | 0 | 0.5 | 0.5 | 2 | 0.38 | 0.85 | 0.77 | 1.62 |
| Brooke Stanislawski | 2 | UT | SD | SF1 | 12 | 1 | 24 | 14 | 1 | 1 | 146 | 23 | 169 | 1 | 1 | 2 | 2 | 0.38 | 0.82 | 0.77 | 1.58 |
| Jennifer Ricaurte | 2 | SE | SD | F | 3 | 7 | 16 | 22 | 0 | 1 | 67 | 129 | 196 | 1 | 0 | 1 | 1 | 0.23 | 1.33 | 0.23 | 1.56 |
| Abby Hecko | 7 | SE | SF | SF2 | 3 | 6 | 9 | 12 | 0 | 2 | 26 | 101 | 127 | 0 | 0 | 0 | 1 | 0.23 | 1.29 | 0.23 | 1.53 |
| Sarah Staller | 24 | UT | SF | 3rd | 10 | 0 | 21 | 13 | 2 | 0 | 33 | 142 | 175 | 1 | 1.5 | 2.5 | 2 | 0.27 | 0.96 | 0.53 | 1.49 |
| Amy Broome | 13 | SF | UT | 3rd | 11 | 3 | 29 | 16 | 0 | 2 | 180 | 13 | 193 | 1 | 0 | 1 | 0 | 0.27 | 1.48 | 0.00 | 1.48 |
| Eliza Pugh | 17 | SF | SE | SF2 | 10 | 3 | 25 | 21 | 0 | 1 | 158 | 10 | 168 | 1 | 0.5 | 1.5 | 2 | 0.22 | 1.04 | 0.44 | 1.47 |
| Alex Diaz | 2 | SD | SE | F | 9 | 2 | 26 | 21 | 1 | 2 | 59 | 140 | 199 | 3.5 | 0 | 3.5 | 1 | 0.22 | 1.21 | 0.22 | 1.44 |
| Cassandra Wong | 17 | SE | SD | F | 3 | 5 | 10 | 11 | 0 | 0 | 113 | 62 | 175 | 0 | 0 | 0 | 1 | 0.23 | 1.20 | 0.23 | 1.43 |
| Alexa Kirkland | 22 | SE | SF | SF2 | 0 | 5 | 14 | 12 | 0 | 1 | 178 | 17 | 195 | 0.5 | 0 | 0.5 | 0 | 0.23 | 1.43 | 0.00 | 1.43 |
| Rachel Bradshaw | 38 | SE | SD | F | 7 | 3 | 29 | 25 | 0 | 2 | 56 | 138 | 194 | 1 | 0.5 | 1.5 | 0 | 0.23 | 1.41 | 0.00 | 1.41 |
| Lily Steponaitis | 29 | SF | UT | 3rd | 1 | 7 | 8 | 15 | 0 | 1 | 17 | 75 | 92 | 0 | 0 | 0 | 2 | 0.27 | 0.84 | 0.53 | 1.38 |
| Kyla Crisp | 11 | UT | SF | 3rd | 9 | 1 | 16 | 11 | 0 | 0 | 147 | 112 | 259 | 0.5 | 1 | 1.5 | 0 | 0.27 | 1.38 | 0.00 | 1.38 |
| Jamie Eriksson | 18 | SE | SF | SF2 | 4 | 6 | 13 | 16 | 1 | 1 | 11 | 93 | 104 | 0 | 0 | 0 | 1 | 0.23 | 1.13 | 0.23 | 1.37 |
| Rebeca Ellis | 9 | SD | SE | F | 6 | 8 | 30 | 32 | 0 | 2 | 169 | 33 | 202 | 2 | 1 | 3 | 1 | 0.22 | 1.14 | 0.22 | 1.36 |
| Jessica Wan | 15 | SD | UT | SF1 | 10 | 2 | 20 | 11 | 3 | 0 | -16 | 147 | 131 | 0.5 | 0 | 0.5 | 0 | 0.38 | 1.34 | 0.00 | 1.34 |
| Casstique Williams | 9 | UT | SF | 3rd | 7 | 1 | 15 | 8 | 2 | 0 | 11 | 199 | 210 | 2 | 0 | 2 | 0 | 0.27 | 1.33 | 0.00 | 1.33 |
| Julia Mankoff | 26 | SF | SE | SF2 | 2 | 3 | 7 | 10 | 1 | 0 | -12 | 167 | 155 | 0 | 0 | 0 | 0 | 0.22 | 1.28 | 0.00 | 1.28 |
| Julia Ting | 4 | SF | UT | 3rd | 11 | 3 | 29 | 16 | 1 | 1 | 171 | 48 | 219 | 2 | 0.5 | 2.5 | 0 | 0.27 | 1.26 | 0.00 | 1.26 |
| Leah Bar-On Simmons | 28 | SE | SF | SF2 | 0 | 7 | 18 | 16 | 2 | 0 | 10 | 59 | 69 | 0 | 0.5 | 0.5 | 2 | 0.23 | 0.78 | 0.47 | 1.24 |
| Mack Perkett | 1 | UT | SF | 3rd | 8 | 1 | 21 | 13 | 1 | 1 | 19 | 136 | 155 | 1 | 1 | 2 | 1 | 0.27 | 0.95 | 0.27 | 1.22 |
| Leslie Willis | 13 | SD | UT | SF1 | 6 | 5 | 14 | 11 | 1 | 0 | 103 | 36 | 139 | 0 | 0 | 0 | 0 | 0.38 | 1.17 | 0.00 | 1.17 |
| Kendra Miller | 34 | UT | SD | SF1 | 4 | 12 | 19 | 24 | 1 | 0 | -5 | 145 | 140 | 1 | 0 | 1 | 1 | 0.38 | 0.79 | 0.38 | 1.17 |
| Yu Ishii | 26 | SD | UT | SF1 | 7 | 10 | 22 | 23 | 0 | 1 | 80 | -1 | 79 | 0 | 0 | 0 | 1 | 0.38 | 0.75 | 0.38 | 1.14 |
| Amy Norris | 3 | UT | SD | SF1 | 2 | 9 | 11 | 19 | 1 | 1 | 51 | 51 | 102 | 0 | 0 | 0 | 0 | 0.38 | 1.12 | 0.00 | 1.12 |
| Ellie Sjordal | 5 | UT | SF | 3rd | 1 | 7 | 10 | 17 | 0 | 1 | 61 | 31 | 92 | 1 | 0 | 1 | 2 | 0.27 | 0.58 | 0.53 | 1.11 |
| Molly Munson | 2 | SF | UT | 3rd | 1 | 12 | 16 | 28 | 0 | 0 | 122 | 38 | 160 | 0 | 1 | 1 | 1 | 0.27 | 0.83 | 0.27 | 1.10 |
| Kendra Miller | 34 | UT | SF | 3rd | 2 | 8 | 11 | 20 | 1 | 0 | 11 | 38 | 49 | 0 | 0 | 0 | 2 | 0.27 | 0.55 | 0.53 | 1.08 |
| Blair Messner | 22 | SD | SE | F | 6 | 5 | 27 | 24 | 2 | 0 | -12 | 108 | 96 | 0 | 1 | 1 | 1 | 0.22 | 0.86 | 0.22 | 1.08 |
| Sadie Jezierski | 77 | SE | SD | F | 7 | 3 | 29 | 25 | 0 | 3 | 172 | 25 | 197 | 6 | 0 | 6 | 2 | 0.23 | 0.63 | 0.45 | 1.08 |
| Kat Songer | 48 | UT | SD | SF1 | 12 | 1 | 24 | 14 | 0 | 4 | 138 | 90 | 228 | 3.5 | 0 | 3.5 | 0 | 0.38 | 1.07 | 0.00 | 1.07 |
| Rachel Bradshaw | 38 | SE | SF | SF2 | 1 | 5 | 16 | 14 | 0 | 1 | 46 | 40 | 86 | 0 | 0 | 0 | 1 | 0.23 | 0.80 | 0.23 | 1.03 |
| Jackelyne Nguyen | 42 | SF | UT | 3rd | 1 | 10 | 15 | 20 | 2 | 0 | -14 | 135 | 121 | 2 | 0 | 2 | 1 | 0.27 | 0.72 | 0.27 | 0.98 |
| Stephanie Lim | 31 | SE | SD | F | 8 | 3 | 30 | 25 | 1 | 0 | 326 | 0 | 326 | 5.5 | 1 | 6.5 | 0 | 0.23 | 0.98 | 0.00 | 0.98 |
| Samantha Loop | 98 | SF | UT | 3rd | 0 | 9 | 9 | 16 | 1 | 0 | 51 | 97 | 148 | 1 | 0 | 1 | 0 | 0.27 | 0.96 | 0.00 | 0.96 |
| Frances Gellert | 13 | SE | SF | SF2 | 4 | 4 | 17 | 15 | 1 | 0 | 39 | 86 | 125 | 1 | 0.5 | 1.5 | 1 | 0.23 | 0.72 | 0.23 | 0.95 |
| Julia Snyder | 27 | SE | SD | F | 3 | 6 | 13 | 16 | 0 | 2 | 129 | 12 | 141 | 2 | 0 | 2 | 0 | 0.23 | 0.94 | 0.00 | 0.94 |
| Jen Cogburn | 99 | UT | SF | 3rd | 10 | 0 | 21 | 12 | 0 | 1 | 84 | 116 | 200 | 1.5 | 1 | 2.5 | 0 | 0.27 | 0.92 | 0.00 | 0.92 |
| Cassandra Wong | 17 | SE | SF | SF2 | 4 | 5 | 10 | 13 | 0 | 1 | 99 | 37 | 136 | 2 | 0 | 2 | 1 | 0.23 | 0.68 | 0.23 | 0.91 |
| Vespera Aragon | 0 | UT | SD | SF1 | 2 | 10 | 12 | 18 | 0 | 1 | 120 | 29 | 149 | 2 | 0 | 2 | 1 | 0.38 | 0.47 | 0.38 | 0.85 |
| Stephanie Lim | 31 | SE | SF | SF2 | 4 | 4 | 19 | 17 | 1 | 0 | 81 | 55 | 136 | 0.5 | 2 | 2.5 | 1 | 0.23 | 0.56 | 0.23 | 0.80 |
| Lexa Stambaugh | 99 | SD | SE | F | 0 | 6 | 10 | 15 | 0 | 1 | 10 | 73 | 83 | 0 | 0 | 0 | 0 | 0.22 | 0.78 | 0.00 | 0.78 |
| Lily Terpstra | 4 | UT | SF | 3rd | 7 | 1 | 19 | 12 | 1 | 1 | 82 | 46 | 128 | 3 | 0 | 3 | 1 | 0.27 | 0.50 | 0.27 | 0.77 |
| Avery Jones | 11 | SD | UT | SF1 | 10 | 9 | 25 | 24 | 2 | 1 | 92 | 96 | 188 | 3.5 | 0.5 | 4 | 1 | 0.38 | 0.39 | 0.38 | 0.77 |
| Jennifer Ricaurte | 2 | SE | SF | SF2 | 4 | 3 | 16 | 14 | 0 | 0 | 14 | 30 | 44 | 0 | 0 | 0 | 2 | 0.23 | 0.30 | 0.47 | 0.77 |
| Leah Bar-On Simmons | 28 | SE | SD | F | 3 | 7 | 14 | 18 | 2 | 0 | -34 | 150 | 116 | 3 | 0 | 3 | 1 | 0.23 | 0.54 | 0.23 | 0.76 |
| Abbie Abramovich | 44 | SE | SF | SF2 | 3 | 5 | 8 | 11 | 0 | 0 | 108 | -1 | 107 | 1 | 0 | 1 | 1 | 0.23 | 0.50 | 0.23 | 0.74 |
| Frances Gellert | 13 | SE | SD | F | 6 | 3 | 26 | 21 | 1 | 1 | 13 | 78 | 91 | 1 | 0.5 | 1.5 | 0 | 0.23 | 0.71 | 0.00 | 0.71 |
| Catherine Chung | 25 | SE | SD | F | 3 | 7 | 14 | 18 | 1 | 0 | 15 | 25 | 40 | 0 | 0 | 0 | 1 | 0.23 | 0.48 | 0.23 | 0.71 |
| Brittany Cabriales | 1 | SD | UT | SF1 | 1 | 6 | 7 | 10 | 0 | 0 | 53 | -12 | 41 | 0 | 0 | 0 | 1 | 0.38 | 0.28 | 0.38 | 0.66 |
| Deanna Abrams | 6 | SD | UT | SF1 | 2 | 10 | 10 | 15 | 1 | 1 | 43 | 48 | 91 | 1 | 0 | 1 | 0 | 0.38 | 0.66 | 0.00 | 0.66 |
| Gina Schumacher | 47 | SF | SE | SF2 | 6 | 0 | 10 | 9 | 0 | 0 | 51 | 74 | 125 | 1 | 0 | 1 | 0 | 0.22 | 0.64 | 0.00 | 0.64 |
| Kristen Pojunis | 4 | SD | SE | F | 4 | 13 | 29 | 36 | 0 | 0 | 83 | 8 | 91 | 3 | 1 | 4 | 4 | 0.22 | -0.27 | 0.90 | 0.63 |
| Abby Hecko | 7 | SE | SD | F | 3 | 5 | 10 | 11 | 1 | 0 | 13 | 79 | 92 | 1 | 0 | 1 | 0 | 0.23 | 0.62 | 0.00 | 0.62 |
| Pin-Wen Wang | 36 | SF | UT | 3rd | 0 | 7 | 11 | 19 | 0 | 1 | 68 | 27 | 95 | 0 | 1 | 1 | 0 | 0.27 | 0.60 | 0.00 | 0.60 |
| Yu Ishii | 26 | SD | SE | F | 9 | 3 | 23 | 18 | 0 | 1 | 55 | 2 | 57 | 0 | 0 | 0 | 0 | 0.22 | 0.60 | 0.00 | 0.60 |
| Molly Munson | 2 | SF | SE | SF2 | 4 | 4 | 17 | 19 | 0 | 0 | 105 | -2 | 103 | 1 | 0.5 | 1.5 | 1 | 0.22 | 0.38 | 0.22 | 0.60 |
| Lexi Garrity | 10 | SE | SD | F | 7 | 3 | 29 | 25 | 0 | 0 | -24 | 110 | 86 | 0 | 0 | 0 | 0 | 0.23 | 0.59 | 0.00 | 0.59 |
| Mara Saltzman | 11 | SF | SE | SF2 | 6 | 1 | 15 | 12 | 1 | 0 | 0 | 54 | 54 | 1 | 0 | 1 | 1 | 0.22 | 0.36 | 0.22 | 0.58 |
| Julia Salvacion | 48 | SD | SE | F | 9 | 4 | 27 | 24 | 0 | 0 | 51 | 59 | 110 | 0 | 2 | 2 | 1 | 0.22 | 0.31 | 0.22 | 0.53 |
| Amanda Rutland | 19 | SD | UT | SF1 | 1 | 10 | 9 | 15 | 0 | 0 | 9 | 11 | 20 | 0 | 1 | 1 | 2 | 0.38 | -0.25 | 0.77 | 0.52 |
| Lexa Stambaugh | 99 | SD | UT | SF1 | 1 | 11 | 10 | 17 | 0 | 0 | 14 | 1 | 15 | 0 | 0 | 0 | 1 | 0.38 | 0.10 | 0.38 | 0.49 |
| Cheryl Hsu | 24 | SE | SD | F | 3 | 5 | 10 | 11 | 0 | 0 | 168 | -67 | 101 | 1 | 0 | 1 | 0 | 0.23 | 0.47 | 0.00 | 0.47 |
| Penny Wu | 47 | SD | UT | SF1 | 2 | 9 | 8 | 13 | 0 | 2 | 113 | 6 | 119 | 2 | 0 | 2 | 0 | 0.38 | 0.47 | 0.00 | 0.47 |
| Amanda Meroux | 33 | SF | SE | SF2 | 10 | 2 | 23 | 20 | 0 | 1 | 51 | 79 | 130 | 2 | 0 | 3 | 0 | 0.22 | 0.44 | 0.00 | 0.44 |
| Amy Broome | 13 | SF | SE | SF2 | 10 | 2 | 24 | 21 | 0 | 0 | 106 | 21 | 127 | 3 | 0 | 3 | 1 | 0.22 | 0.21 | 0.22 | 0.43 |
| Julia Mankoff | 26 | SF | UT | 3rd | 1 | 9 | 14 | 25 | 0 | 0 | -21 | 62 | 41 | 0 | 0.5 | 0.5 | 1 | 0.27 | 0.15 | 0.27 | 0.42 |
| Jackelyne Nguyen | 42 | SF | SE | SF2 | 3 | 6 | 18 | 20 | 0 | 1 | 9 | 51 | 60 | 2 | 0 | 2 | 1 | 0.22 | 0.18 | 0.22 | 0.40 |
| Molly Robbins | 8 | UT | SF | 3rd | 2 | 8 | 16 | 25 | 0 | 0 | 5 | 33 | 38 | 0.5 | 1 | 1.5 | 2 | 0.27 | -0.14 | 0.53 | 0.39 |
| Hana Kawai | 15 | SE | SD | F | 7 | 3 | 29 | 25 | 1 | 0 | 56 | 115 | 171 | 4 | 3.5 | 7.5 | 3 | 0.23 | -0.31 | 0.68 | 0.37 |
| Kaitlynne Roling | 12 | SE | SD | F | 3 | 7 | 14 | 18 | 0 | 0 | -9 | 58 | 49 | 1 | 0 | 1 | 1 | 0.23 | 0.11 | 0.23 | 0.34 |
| Shira Stern | 30 | SE | SF | SF2 | 3 | 6 | 9 | 12 | 0 | 0 | -16 | 28 | 12 | 0 | 1 | 1 | 2 | 0.23 | -0.15 | 0.47 | 0.32 |
| Samantha Loop | 98 | SF | SE | SF2 | 2 | 3 | 10 | 12 | 0 | 0 | 24 | 23 | 47 | 0 | 0 | 0 | 0 | 0.22 | 0.32 | 0.00 | 0.32 |
| Sally Mimms | 23 | SF | SE | SF2 | 5 | 1 | 10 | 8 | 0 | 0 | -7 | 51 | 44 | 0 | 0 | 0 | 0 | 0.22 | 0.30 | 0.00 | 0.30 |
| Laura To | 3 | SE | SF | SF2 | 3 | 5 | 8 | 11 | 1 | 0 | 34 | 43 | 77 | 2 | 0 | 2 | 0 | 0.23 | 0.27 | 0.00 | 0.27 |
| Jen Cogburn | 99 | UT | SD | SF1 | 11 | 0 | 16 | 8 | 1 | 1 | 84 | 32 | 116 | 1 | 1.5 | 2.5 | 0 | 0.38 | 0.26 | 0.00 | 0.26 |
| Ikran Elmi | 0 | SE | SF | SF2 | 1 | 6 | 19 | 17 | 0 | 1 | 89 | 2 | 91 | 3 | 0.5 | 3.5 | 1 | 0.23 | 0.02 | 0.23 | 0.25 |
| Deanna Abrams | 6 | SD | SE | F | 4 | 3 | 8 | 7 | 1 | 0 | 12 | 25 | 37 | 1 | 0 | 1 | 0 | 0.22 | 0.24 | 0.00 | 0.24 |
| Amanda Rutland | 19 | SD | SE | F | 1 | 2 | 10 | 9 | 1 | 0 | 0 | 5 | 5 | 0 | 0 | 0 | 0 | 0.22 | 0.24 | 0.00 | 0.24 |
| Kari Shelkey | 12 | UT | SF | 3rd | 1 | 8 | 10 | 18 | 0 | 0 | 16 | 17 | 33 | 0 | 0 | 0 | 0 | 0.27 | 0.23 | 0.00 | 0.23 |
| Sydney Horanic | 8 | SD | SE | F | 0 | 1 | 1 | 2 | 0 | 0 | -4 | 38 | 34 | 0 | 0 | 0 | 0 | 0.22 | 0.23 | 0.00 | 0.23 |
| Ikran Elmi | 0 | SE | SD | F | 3 | 5 | 9 | 11 | 0 | 0 | 38 | -4 | 34 | 1 | 0 | 1 | 1 | 0.23 | 0.01 | 0.23 | 0.23 |
| Lexi Garrity | 10 | SE | SF | SF2 | 4 | 3 | 16 | 14 | 1 | 0 | -22 | 75 | 53 | 0 | 1.5 | 2.5 | 1 | 0.23 | -0.01 | 0.23 | 0.23 |
| Jaclyn Wataoka | 58 | SF | SE | SF2 | 3 | 4 | 14 | 18 | 1 | 0 | 61 | 6 | 67 | 2 | 1 | 3 | 1 | 0.22 | 0.01 | 0.22 | 0.23 |
| Theresa Zettner | 7 | SD | SE | F | 6 | 2 | 17 | 17 | 1 | 0 | -9 | 76 | 67 | 2 | 0 | 2 | 0 | 0.22 | 0.22 | 0.00 | 0.22 |
| Brittany Cabriales | 1 | SD | SE | F | 3 | 0 | 7 | 3 | 0 | 0 | 22 | 9 | 31 | 0 | 0 | 0 | 0 | 0.22 | 0.21 | 0.00 | 0.21 |
| Leslie Willis | 13 | SD | SE | F | 6 | 0 | 15 | 13 | 0 | 0 | 34 | 27 | 61 | 1 | 1 | 2 | 1 | 0.22 | -0.03 | 0.22 | 0.20 |
| Samantha Wool | 25 | SD | UT | SF1 | 0 | 9 | 10 | 14 | 1 | 0 | 32 | 22 | 54 | 1 | 0 | 1 | 0 | 0.38 | 0.20 | 0.00 | 0.20 |
| Lily Terpstra | 4 | UT | SD | SF1 | 11 | 0 | 17 | 12 | 0 | 1 | 63 | 47 | 110 | 2 | 0 | 2 | 0 | 0.38 | 0.20 | 0.00 | 0.20 |
| Ellie Sjordal | 5 | UT | SD | SF1 | 3 | 9 | 11 | 19 | 0 | 0 | 78 | 6 | 84 | 1 | 0 | 1 | 0 | 0.38 | 0.19 | 0.00 | 0.19 |
| Marlena Luhr | 19 | SF | SE | SF2 | 2 | 1 | 9 | 14 | 0 | 0 | -12 | 72 | 60 | 1 | 0 | 1 | 0 | 0.22 | 0.19 | 0.00 | 0.19 |
| Marlena Luhr | 19 | SF | UT | 3rd | 0 | 4 | 7 | 14 | 0 | 0 | -2 | 48 | 46 | 0.5 | 0 | 0.5 | 0 | 0.27 | 0.18 | 0.00 | 0.18 |
| Cori Bigham | 38 | UT | SF | 3rd | 8 | 1 | 20 | 11 | 0 | 0 | -2 | 47 | 45 | 0 | 0.5 | 0.5 | 0 | 0.27 | 0.18 | 0.00 | 0.18 |
| Rachel Clarkson | 27 | SF | SE | SF2 | 3 | 2 | 14 | 13 | 0 | 0 | 5 | 19 | 24 | 1 | 1 | 2 | 2 | 0.22 | -0.27 | 0.44 | 0.17 |
| Kelli Iwamoto | 20 | SD | SE | F | 9 | 5 | 24 | 22 | 0 | 0 | 95 | 40 | 135 | 2.5 | 1 | 3.5 | 0 | 0.22 | 0.14 | 0.00 | 0.14 |
| Sarah Staller | 24 | UT | SD | SF1 | 12 | 1 | 24 | 14 | 2 | 0 | 0 | 127 | 127 | 2 | 1 | 3 | 0 | 0.38 | 0.14 | 0.00 | 0.14 |
| Amy Norris | 3 | UT | SF | 3rd | 1 | 6 | 6 | 13 | 0 | 0 | 10 | 9 | 19 | 0 | 0 | 0 | 0 | 0.27 | 0.13 | 0.00 | 0.13 |
| Linnea Soo | 32 | SE | SD | F | 3 | 7 | 15 | 18 | 0 | 0 | 23 | -4 | 19 | 0 | 0 | 0 | 0 | 0.23 | 0.13 | 0.00 | 0.13 |
| Rachel Clarkson | 27 | SF | UT | 3rd | 5 | 2 | 11 | 8 | 0 | 0 | 6 | 50 | 56 | 0 | 1 | 1 | 0 | 0.27 | 0.12 | 0.00 | 0.12 |
| Sydney Horanic | 8 | SD | UT | SF1 | 2 | 5 | 9 | 10 | 0 | 1 | 18 | 79 | 97 | 2 | 0 | 2 | 0 | 0.38 | 0.11 | 0.00 | 0.11 |
| Eliza Chang | 16 | SF | SE | SF2 | 2 | 4 | 15 | 21 | 0 | 0 | -6 | 53 | 47 | 1 | 0 | 1 | 0 | 0.22 | 0.10 | 0.00 | 0.10 |
| Cheryl Hsu | 24 | SE | SF | SF2 | 1 | 6 | 19 | 17 | 1 | 0 | 117 | -1 | 116 | 3 | 0 | 4 | 0 | 0.23 | 0.08 | 0.00 | 0.08 |
| Mack Perkett | 1 | UT | SD | SF1 | 12 | 0 | 19 | 13 | 0 | 0 | -6 | 128 | 122 | 1 | 1 | 2 | 0 | 0.38 | 0.07 | 0.00 | 0.07 |
| Kyra Khoroujnikova | 22 | UT | SD | SF1 | 2 | 7 | 4 | 12 | 0 | 1 | 15 | 20 | 35 | 1 | 0 | 1 | 0 | 0.38 | 0.07 | 0.00 | 0.07 |
| Drea Baroma | 23 | SE | SF | SF2 | 3 | 5 | 8 | 11 | 0 | 0 | 0 | 9 | 9 | 0 | 0 | 0 | 0 | 0.23 | 0.06 | 0.00 | 0.06 |
| Kyra Khoroujnikova | 22 | UT | SF | 3rd | 1 | 5 | 6 | 12 | 0 | 0 | -26 | 30 | 4 | 0 | 0 | 0 | 0 | 0.27 | 0.03 | 0.00 | 0.03 |
| Abbie Abramovich | 44 | SE | SD | F | 3 | 7 | 14 | 18 | 0 | 0 | 129 | -26 | 103 | 2 | 0 | 3 | 0 | 0.23 | 0.03 | 0.00 | 0.03 |
| Blair Messner | 22 | SD | UT | SF1 | 8 | 4 | 14 | 13 | 0 | 0 | 22 | 38 | 60 | 0 | 1 | 1 | 0 | 0.38 | 0.03 | 0.00 | 0.03 |
| Shaela Wallen | 16 | UT | SF | 3rd | 1 | 9 | 10 | 19 | 0 | 0 | 9 | 14 | 23 | 1 | 0.5 | 1.5 | 1 | 0.27 | -0.24 | 0.27 | 0.02 |
| Samantha Wool | 25 | SD | SE | F | 0 | 2 | 0 | 2 | 0 | 0 | 0 | 0 | 0 | 0 | 0 | 0 | 0 | 0.22 | 0.00 | 0.00 | 0.00 |
| Anna Sivinski | 93 | SD | SE | F | 0 | 1 | 0 | 1 | 0 | 0 | 0 | 0 | 0 | 0 | 0 | 0 | 0 | 0.22 | 0.00 | 0.00 | 0.00 |
| Kelli Iwamoto | 20 | SD | UT | SF1 | 11 | 3 | 19 | 13 | 0 | 1 | 113 | -4 | 109 | 2.5 | 0 | 2.5 | 0 | 0.38 | 0.00 | 0.00 | 0.00 |
| Brittany McCready | 29 | UT | SD | SF1 | 2 | 7 | 4 | 12 | 0 | 0 | 0 | 0 | 0 | 0 | 0 | 0 | 0 | 0.38 | 0.00 | 0.00 | 0.00 |
| Carly Atwell | 27 | UT | SD | SF1 | 3 | 10 | 11 | 19 | 0 | 0 | 99 | 10 | 109 | 3 | 0 | 3 | 1 | 0.38 | -0.40 | 0.38 | -0.02 |
| Kara Hammer | 44 | SF | SE | SF2 | 9 | 0 | 18 | 16 | 0 | 1 | 45 | 66 | 111 | 4.5 | 0 | 4.5 | 0 | 0.22 | -0.02 | 0.00 | -0.02 |
| Sally Mimms | 23 | SF | UT | 3rd | 4 | 3 | 16 | 10 | 0 | 0 | 8 | 5 | 13 | 0 | 0.5 | 0.5 | 0 | 0.27 | -0.04 | 0.00 | -0.04 |
| Jaclyn Wataoka | 58 | SF | UT | 3rd | 1 | 8 | 8 | 17 | 0 | 0 | 14 | 16 | 30 | 1 | 0 | 1 | 0 | 0.27 | -0.06 | 0.00 | -0.06 |
| Lily Steponaitis | 29 | SF | SE | SF2 | 2 | 5 | 13 | 18 | 0 | 0 | 12 | 29 | 41 | 1 | 1 | 2 | 0 | 0.22 | -0.16 | 0.00 | -0.16 |
| Madeline Hunter | 25 | UT | SF | 3rd | 1 | 7 | 6 | 14 | 0 | 0 | 8 | 3 | 11 | 1 | 0 | 1 | 0 | 0.27 | -0.19 | 0.00 | -0.19 |
| Eliza Chang | 16 | SF | UT | 3rd | 1 | 8 | 12 | 21 | 0 | 0 | 23 | -15 | 8 | 1 | 0 | 1 | 0 | 0.27 | -0.21 | 0.00 | -0.21 |
| Carly Atwell | 27 | UT | SF | 3rd | 1 | 8 | 10 | 18 | 0 | 0 | 28 | 0 | 28 | 1 | 0.5 | 1.5 | 0 | 0.27 | -0.21 | 0.00 | -0.21 |
| Patricia Anderson | 96 | SF | SE | SF2 | 4 | 1 | 9 | 8 | 0 | 0 | 14 | -13 | 1 | 1 | 0 | 1 | 0 | 0.22 | -0.21 | 0.00 | -0.21 |
| Madeline Hunter | 25 | UT | SD | SF1 | 2 | 10 | 10 | 17 | 1 | 0 | 19 | -1 | 18 | 1.5 | 0 | 1.5 | 0 | 0.38 | -0.24 | 0.00 | -0.24 |
| Alexa Kirkland | 22 | SE | SD | F | 3 | 5 | 10 | 11 | 0 | 0 | -20 | 7 | -13 | 2 | 0 | 2 | 1 | 0.23 | -0.54 | 0.23 | -0.32 |
| Jessica Wan | 15 | SD | SE | F | 4 | 1 | 9 | 9 | 0 | 0 | 0 | 0 | 0 | 0 | 1.5 | 1.5 | 0 | 0.22 | -0.34 | 0.00 | -0.34 |
| Jorie Moore | 28 | SD | UT | SF1 | 0 | 6 | 8 | 11 | 0 | 0 | 0 | 0 | 0 | 0 | 1 | 1 | 0 | 0.38 | -0.38 | 0.00 | -0.38 |
| Penny Wu | 47 | SD | SE | F | 5 | 3 | 10 | 9 | 0 | 0 | 7 | 26 | 33 | 3 | 0 | 3 | 0 | 0.22 | -0.45 | 0.00 | -0.45 |
| Brittany McCready | 29 | UT | SF | 3rd | 1 | 5 | 6 | 12 | 0 | 0 | 13 | -3 | 10 | 0 | 2 | 2 | 0 | 0.27 | -0.46 | 0.00 | -0.46 |
| Casstique Williams | 9 | UT | SD | SF1 | 12 | 0 | 19 | 13 | 0 | 0 | -2 | 46 | 44 | 3 | 0 | 3 | 1 | 0.38 | -0.85 | 0.38 | -0.46 |
| Julia Ting | 4 | SF | SE | SF2 | 9 | 4 | 24 | 20 | 0 | 0 | 90 | -3 | 87 | 5 | 1 | 6 | 1 | 0.22 | -0.72 | 0.22 | -0.50 |
| Meeri Chang | 21 | SF | UT | 3rd | 1 | 11 | 16 | 28 | 0 | 0 | 147 | -26 | 121 | 6 | 0 | 6 | 0 | 0.27 | -0.77 | 0.00 | -0.77 |
| Vespera Aragon | 0 | UT | SF | 3rd | 2 | 6 | 16 | 23 | 0 | 0 | 56 | 5 | 61 | 4.5 | 0 | 5.5 | 1 | 0.27 | -1.05 | 0.27 | -0.78 |
More specifically, this is the WUL’s description: The Offense-Defense Scale is defensive points started plus defensive substitutions divided by total points started plus total substitutions; a 0 represents a pure offensive player while a 100 represents a pure defensive player. ↩
Although the scale is reversed in the BBSM data, where handlers are the 67-100 segment instead of 0-33 ↩
Abby Hecko’s three-game OIS was 4th highest, but two games below the qualifying threshold. Further confirming the similarity of the WUL’s OIS metric and BBSM’s EO100, the Hecko and Rodenburg EO100 scores were 3rd and 23rd in the league, respectively. ↩