November 15, 2012 by Sean Childers in Analysis with 18 comments
This is the second part in our defensive series on the statistics of NexGen. Photo courtesy of Ultiphotos’ Kevin Leclaire. Check out more photos of the NexGen tour.
Before we can begin analyzing the data, we have to determine what we consider to be the “best result” for NexGen. I defined success for NexGen as the percent of the overall points they scored in a given game. When NexGen scored more of the points played, they played better and were more successful than when they won fewer of the points played. Of course, in ultimate, winning more than 50% of the points results in a win.
While using scoring margin as a definition has problems in its own right1, it is generally preferred in sports analytics for at least two reasons. First, it allows us to say whether some wins are better than others; blowout wins were more successful than narrow wins controlling for everything else. But more importantly, scoring margin better predicts the future success of a team than its win-loss records.2
Why Do We Think Defense Was More Important For NexGen’s Success Than Offense?
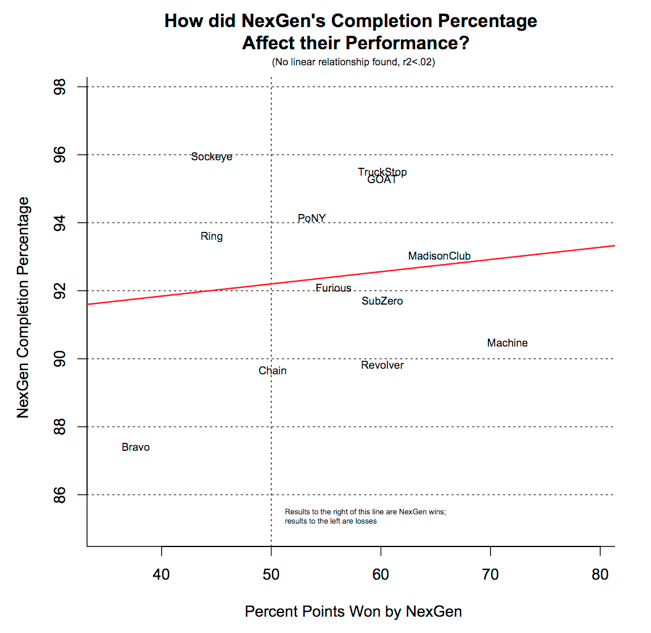
I first started by looking at offensive metrics for NexGen on a per-game basis. The most obvious offensive metric in ultimate is completion percentage: to score on any given possession you need to complete all of your passes in that possession. So one would expect that having a higher completion percentage over the course of a game would generally lead to winning more points:
The vertical axis here shows NexGen’s game-wide completion percentage in all of the games coded3. While NexGen’s worst game was also the game where they had the lowest completion percentage (Johnny Bravo), there is no statistically significant correlation in the graph. Some games where NexGen completed a high percentage of passes nonetheless resulted in losses (e.g. Sockeye) while at least one game with a less than impressive completion percentage resulted in a blowout NexGen win (Machine).
Maintaining a super high completion percentage is most important for teams who need to complete a lot of passes in order to score. If your team is typically throwing a lot of passes in each offensive possession, an early turnover might hand the disc over to the opposition in your half — favorable field position for them. But this relationship holds true for another reason: yardage is an important offensive statistic, one which has probably been overlooked in the traditional and simple goals-assists-touches statistical approach.4
Imagine two teams with equal completion rates of 80%, but one team who averages 10 yards per completion but another that only hucks the disc and averages 50 yards per completion. The first team will turn the disc on over by about their third pass on each offensive possession, on average. Assuming both teams start with the disc at half field for five offensive possessions, the second team will score on 4 out of 5 of their offensive possessions. The first team, which only averages 10 yards per completion, needs to complete 4 passes in a row to score (the odds of doing so are about 40%), meaning they will only score 2 out of their 5 offensive possessions.
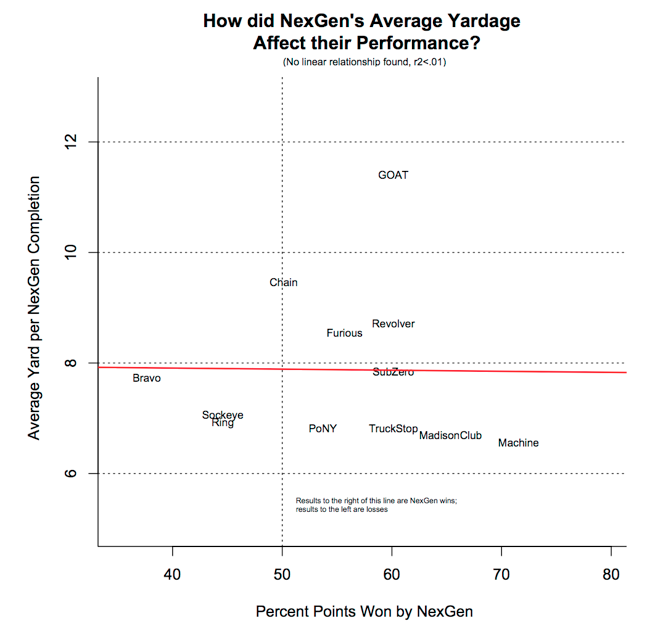
So perhaps completion percentage should be viewed in light of yards per completion. Because maintaining a high completion percentage is most important for teams that need a lot of passes in order to score, a huck-happy team like NexGen (discussed more later) can probably sacrifice some completion percentage if they are getting more yards per completion on average. We might find that the amount of yards obtained per completion5was a more important predictor of success than their raw completion percentage.
The relationship here is even worse than the relationship between completion percentage and scoring margin. The slight downward trajectory of some of the data points is nowhere close to statistically significant — plus it runs in the opposite direction of a general offensive theory anyways. If someone told you at the end of a NexGen game how many yards NexGen obtained on their average completion, you would still not be able to reliably predict how well the team performed as a whole.
So, at least for the two main offensive variables we recorded, there is no correlation or predictive pattern between those variables and NexGen’s scoring margin. But what about defense?
Two Defensive Performance Graphs:
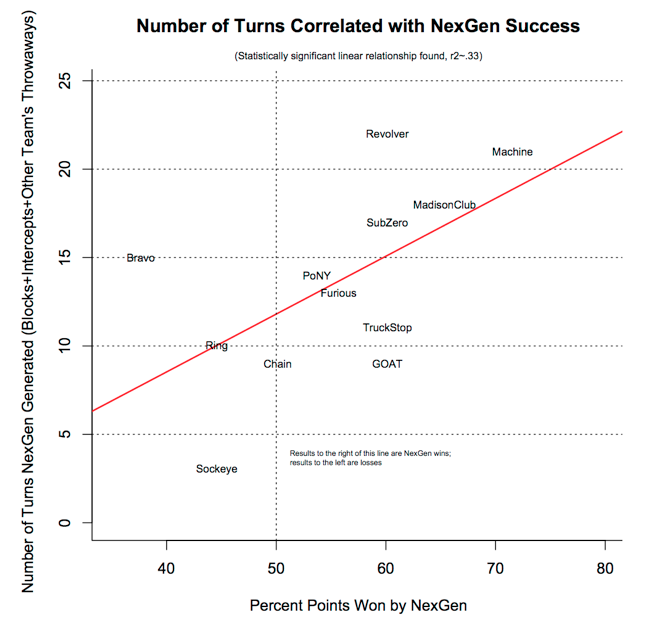
Graph 3:
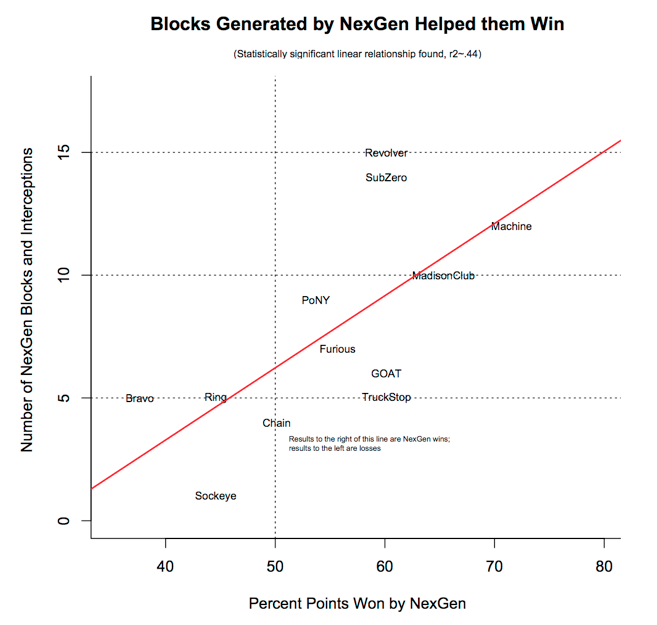
Graph 4:
These two graphs both measure some variable of NexGen defensive performance. And they also show a clear visual line of best fit running from the bottom left to the top right and an unequivocal story: As the NexGen played better defense game-wide, they were more successful and outscored their opponents by more.
Graphs 3 and 4 look at defensive statistics regardless of whether it was a NexGen O Line or D Line point (it includes data from all points, both those where NexGen started on defense and when they received the pull and started on offense). After all, good defense also includes playing good defense after your O Line turns it.
Graph 3 looks at the number of turnovers NexGen generated, including NexGen blocks and interceptions as well as throwaways by the other team. This graph is essentially the same as looking at the opposition’s completion percentage: as the opponents completed a higher percentage of their passes, NexGen performance worsened.6 This is an especially interesting finding because we earlier found no statistically significant relationship between NexGen’s completion percentage and their success — it’s surprising to find the effect on one side of the disc but not the other.
Graph 4 only looks at the number of blocks and interceptions that NexGen collected; it ignores mere throwaways. While the limited number of games should, of course, caution against any grandiose conclusion, it is interesting to note that the number of blocks and intercepts data better predicts NexGen performance than the combined number of turnovers. Including throwaways reduces the predictive power of the model: Graph 4 has an r-squared value of .44, whereas the model represented in Graph 3 has an r-squared value of .33.7 Furthermore, the value of the coefficient is greater in the model represented by Graph 3: a one unit increase in the number of blocks and interceptions NexGen generated in a game has a slightly greater effect than a one unit increase in number of blocks, interceptions and throwaways. Both models measure very similar things, but the one that we might associate with more athletic defensive “playmaking” appears, for the time being, to be a tad bit more important.
Overall, though, both graphs tell the now-unsurprising story: As defensive performance increased, NexGen’s scoring margin tended to increase as well. Though there are outliers (e..g, the Bravo game on Graph 4), the formal statistical tests think that the odds of these relationships occurring by mere statistical chance are about one in twenty and one out of fifty, respectively.
Of course it seems obvious and intuitive that a team should score more points as they generate more D’s. Then again, one would expect a team to score more points as they complete a higher percentage of their passes. What we’re seeing, at least from the NexGen team, is the data currently (and surprisingly) only supports the defensive proposition.8
Tomorrow we will analyze what we don’t see, how playing style could affect these results, and the limitations to this theory.
Here are just a few examples: Weather may limit the amount of points a team can realistically win by (or do the opposite and especially punish weaker teams), luck in any given game may give a skewed picture of the performances in that given game, or a coach may rest his stronger players as the score margin increases. ↩
John Hollinger, when explaining his NBA power rankings methodology, writes, “So instead of winning percentage, these rankings use points scored and points allowed, which are better indicators of a team’s quality than wins and losses. This might not sound right at first, but studies have shown scoring margin to be a better predictor of future success than a team’s win-loss record. Thus, scoring margin is a more accurate sign of a team’s quality. That explains why, for instance, five seasons ago the Spurs ranked ahead of the Mavericks even though they had won nine fewer games — San Antonio’s scoring margin was superior. That ultimately proved to be prophetic, as Dallas lost in the first round of the playoffs, while the Spurs won the championship.” ↩
In general, when reading these sort of graphs, you want to look to see if there is a line that best-fits a lot of the data points. A statistical test called a regression equation can also provide useful information by telling us if one variable (here, the completion percentage) predicts the other variable (the percentage of points scored) in a reliable enough manner that it is unlikely to have occurred by mere statistical chance. The regression outputs are available at the end. ↩
Future articles will continue to address the theme of “why yardage matters” and how it has been overlooked in previous statistical-gathering attempts. ↩
Our specification is that “yardage” is defined as the number of vertical yards obtained in a throw — in other words, a swing pass all the way across the field could be recorded as a 0 yard throw even though it obviously traveled a lot of yards. ↩
We ensured this was the same by also calculating the completion percentage of NexGen’s opponents; we found that the two graphs and equations were essentially identical except for the fact that they ran in opposite directions (As NexGen turnovers generated increased, the percent of points they scored increased, but that reflects a decrease in opposition completion percentage. The coefficients are equal but the direction of the effect, as one would expect, is reversed). ↩
http://en.wikipedia.org/wiki/Coefficient_of_determination ↩
In the long run, we certainly expect to see offensive variables like completion percentage to have a measureable effect on team performance. As more data gets collected, though, it will be interesting to see if defensive performance nonetheless remains more important. ↩
