Women do less than expected on the field in elite mixed ultimate.
May 7, 2015 by Jane Carlen in Analysis with 77 comments
As one of the captains of Viva, Los Angeles’ top women’s club team, I think a lot about what each division offers female players. Though I have fun playing mixed in the offseason, I prefer women’s because I think it demands far more of me as a player. I know every player and team experience is different, but I can’t shake the feeling (left over from my days playing mixed club) that women in mixed don’t get to contribute as much as men.
I’ve argued this with various players over the years, but the discussion usually fizzles out in competing anecdotal evidence. Tired of the back and forth, I decided to try to get an objective understanding of the impact of women in the coed game using data from USA Ultimate.
The data I examined shows a significant gap between the percentage of goals, assists, blocks, and turnovers that female players account for and the percentage one would expect if gender did not influence the statistics.
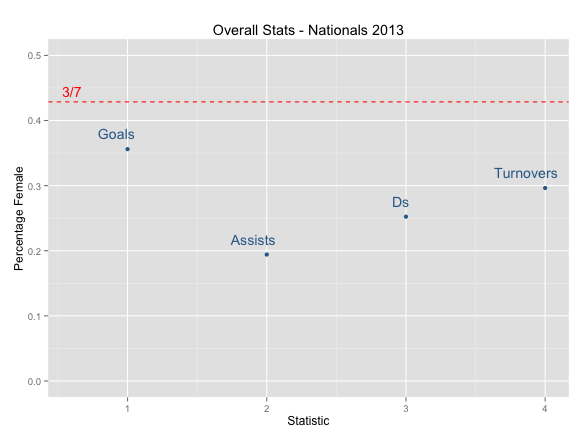
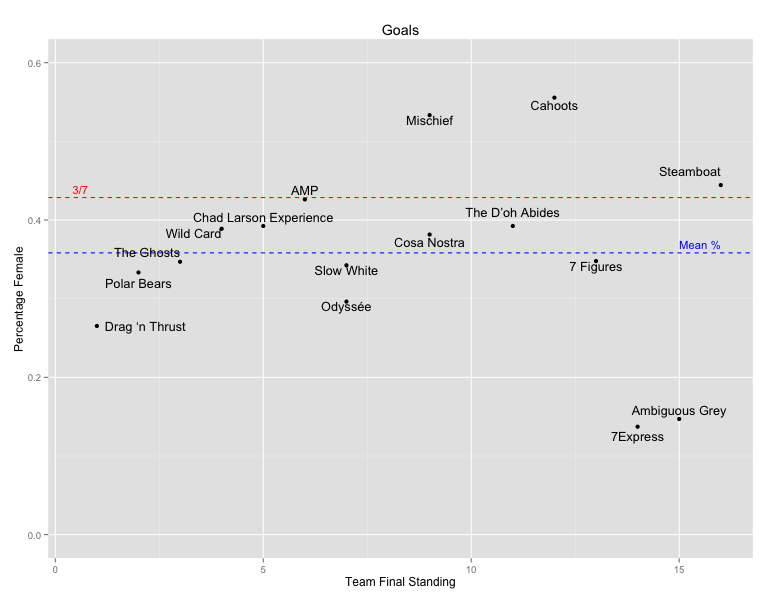
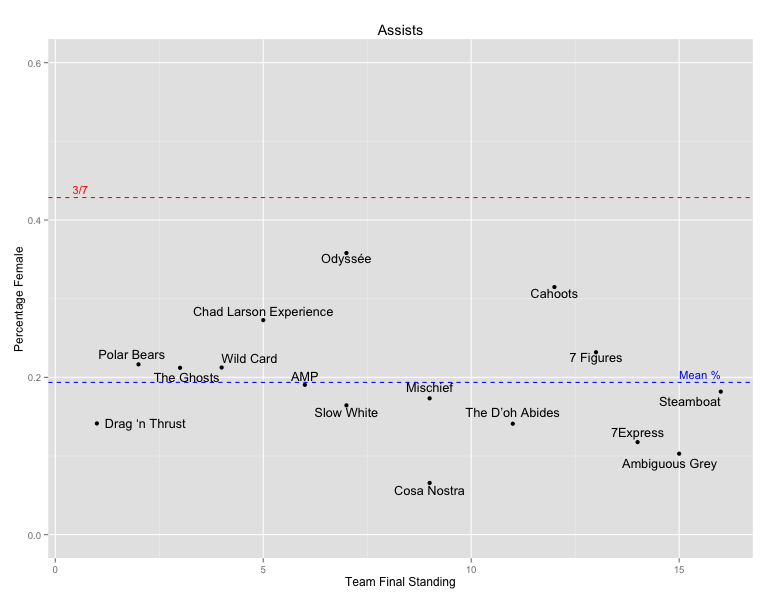
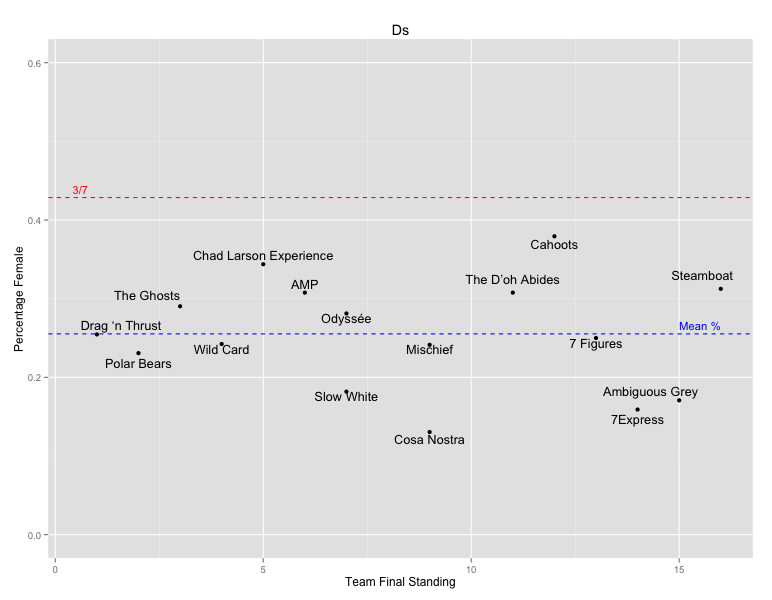
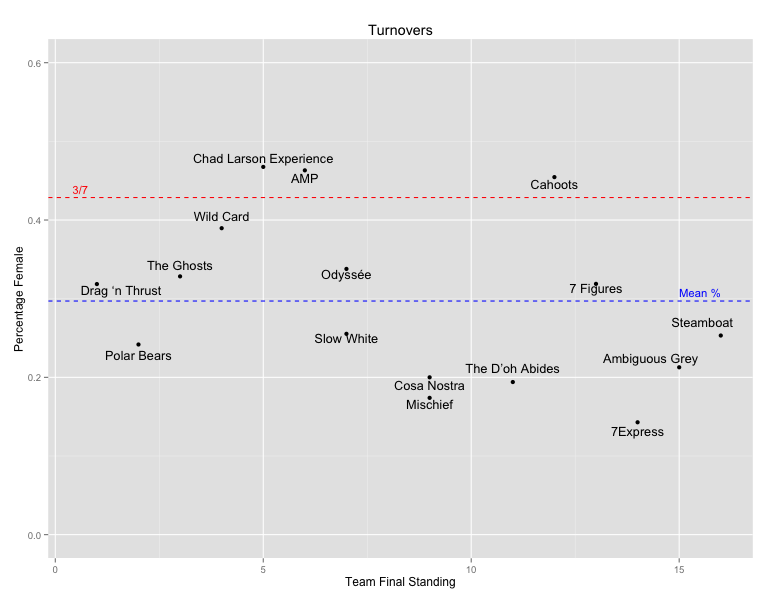
Below are five plots of the data from 2013 Mixed Nationals, using statistics published by USAU. (I used the 2013 data because it was easier to scrape from the USAU website than 2014.) Each plot shows the percentages of Goals, Ds, Assists and Turnovers attributed to women overall and for each team, along with a red line that represents 3/7 (42.9%) — the percentage that women should account for if production is entirely equal and offense always chooses 3/4. The blue line in each plot (except the overall plot) represents the mean percentage of women’s contributions with each team weighted equally.
Data Summary
- Women are most underrepresented in assists (mean = 19.4%), and least underrepresented in goals (mean = 35.8%), but they are still underrepresented across the board. Female players account for an average 25.5% of blocks and 29.7% of turnovers.
- Where are women are overrepresented? Three teams had women with disproportionately high goal percentages (max = 55.6% on Cahoots) and three teams had women with disproportionately high turnovers (max = 46.8% on Chad Larson).
- No strong patterns emerged between female performance and team performance. One slight trend is that there is smaller variance in female goal percentage for higher-finishing teams. It would be interesting to see if that reappeared in 2014.
- Statistical significance: If each goal/assist/block/turnover actually had a 3/7 chance of being attributed to a female player (which of course is false because it varies by position and team), than the chance of observing the overall statistics reported by USAU is essentially zero. In other words, the data implies that the true expected percentages must be lower. Using a similar calculation based on team means, I reached the same conclusion.
Team Leaders
Because these are aggregated statistics and I know that some teams have women who dominate in certain categories, I also looked at individual team leaders. Women are well represented as leaders in goals, but not in any other category.
- Goals: Six teams had female goal leaders (Amp, Cahoots, Mischief, Steamboat, D’oh Abides, Wild Card) and two more teams had male-female ties (7 Figures, Cosa Nostra)
- Blocks: Two teams (D’oh Abides and Wild Card) had a female block leader. It is the same woman as their female goal leader.
- Turnovers: Three teams (7 Figures, Amp, Chad Larson) had female turnover leaders and one more was tied (Odyssée)
- Assists: Only one team (Odyssée) had a female assist leader
Additional Questions About The Data
I am told that the USAU stats are pretty unreliable. They’re taken by volunteers who aren’t especially familiar with the team or even incentivized to do good work—the bottom of the volunteer totem pole. The odds that a given team’s or player’s statistics are accurate is low, but is there any reason to think that one gender’s statistics are more inaccurate? Furthermore, a few stats were attributed to unknown players, but I also have no reason to believe that the “missingness” is biased by gender.
My analysis assumes that teams go 4 men – 3 women all of the time, but sometimes teams do choose to go 4 women – 3 men. How often does that occur at Club Nationals? Teams that often go 4/3 should have expected female percentages closer to 50%.
Where teams choose to employ their players, positionally, could also make a difference. Handlers get more touches, more assists, more turnovers, and sometimes even more goals. Which teams use three or four female cutters, and do any teams use three female handlers? Those strategies also impact expectations.
Discussion
This data supports the argument that men more strongly impact the outcomes in mixed ultimate than do women. Additionally, the disparity seems to be larger among handlers than cutters. This may be due to fewer females playing as handlers, but if that is the case then the goal disparity becomes more stark.
The data also reaffirms my admittedly preconceived belief that athletic female receivers can carve out a more valuable role for themselves on a mixed team—catching goals and getting Ds—than can female throwers. Some may argue that this data overlooks women’s contribution as throwers because they tend to work the disc through the middle of the field. But with women accounting for only 19.4% of assists it seems hard to argue that women get close to as many touches outside the endzone as men.
Given that women are least underrepresented in the goals category, I wonder if there is any difference in how women and men score goals. For example, are women more likely to be isolation cutters in the endzone because they can more easily get open in a small space? Which gender catches more hucks? This also raises the question of what percentage of goals in mixed are scored on hucks vs. short passes.
Perhaps most importantly, though: are elite female coed players at all surprised by these statistics?
I hope to eventually compare this data to 2014 Nationals and other data. I looked into whether WFDF Worlds 2014 reported coed data, but only found published statistics (goals and assists) for the finals. (They are even more lopsided than the data above. In a game won by Drag’n Thrust 17-10, women on Drag’n Thrust had 3 (17.6%) and 2 (11.8%) of the goals and assists respectively, while women on Polar Bears had 1 (10%) and 2 (20%).) It would be nice to have data on touches all the way down the field instead of just the final touch (assists), but I’m unaware of anyone who has recorded that kind of data for mixed.
Of course, people have many reasons for choosing their team (fun, friends, location, risk of injury, etc.), but I hope that this informs the debate on some of them.
