December 11, 2019 by Charlie Enders and Charlie Eisenhood in Analysis with 0 comments
On Monday, USA Ultimate announced the 208 players invited to the USA National Team tryouts in early 2020. While there has been plenty of chatter online about the players that were (or weren’t) invited, we thought we would look closer at the aggregated stats of the tryouts. Let’s dive in.
What were the splits between the single gender and mixed divisions?
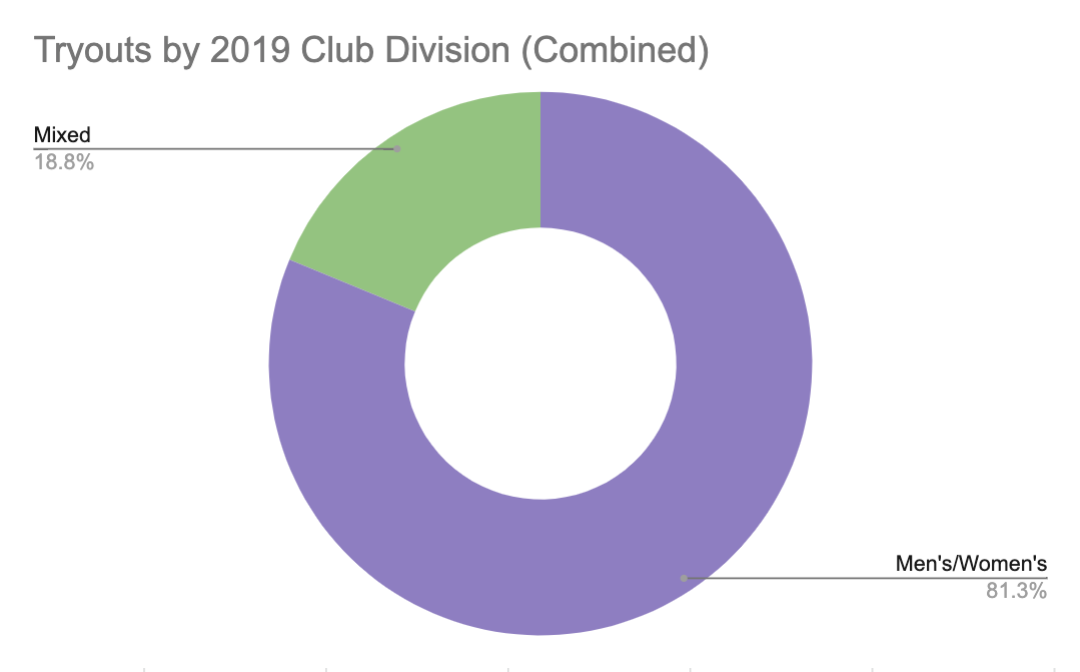
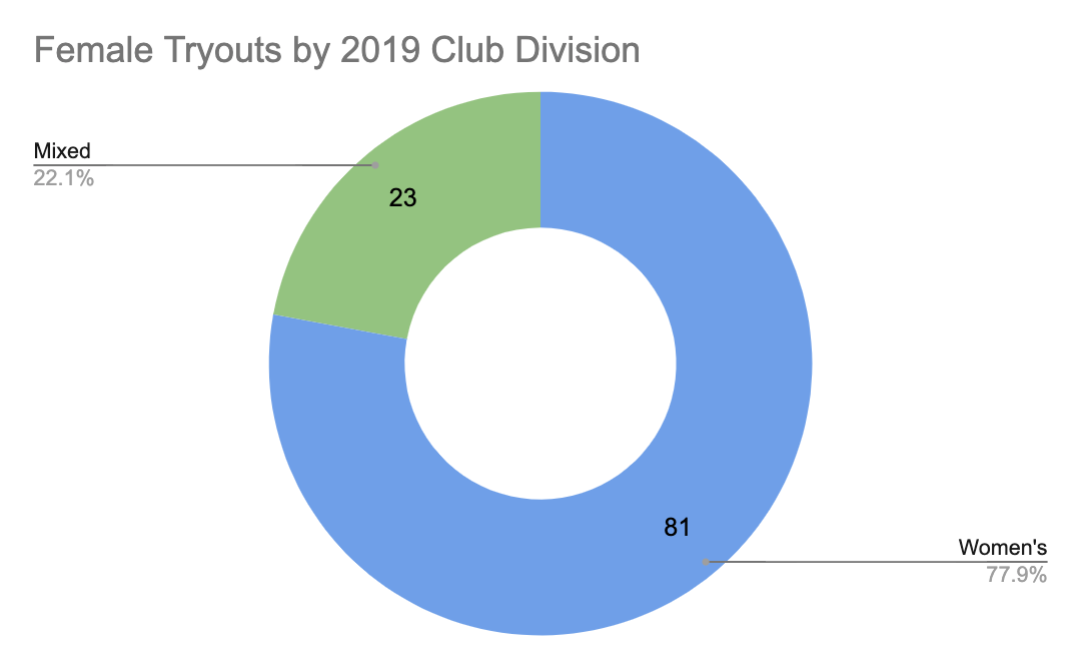
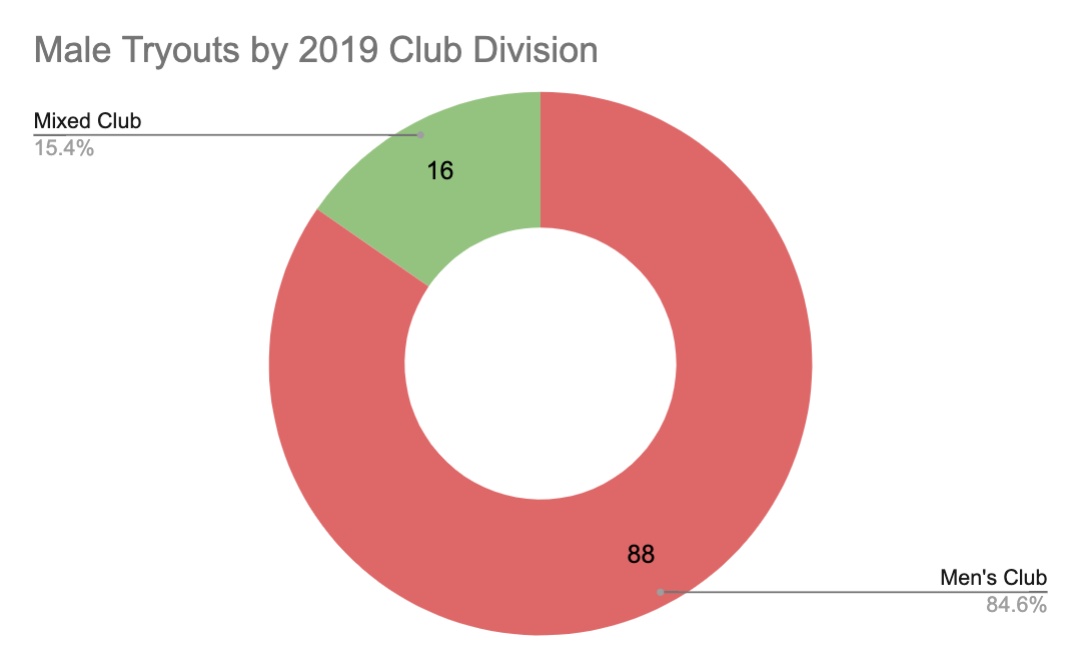
Notes:
- In 2016, 21 women and 13 men were invited from the mixed division (tryouts were hosted 210 players, two more than this year), representing 16.2% of the invites.
- Five more mixed division players were invited to tryouts this year compared to 2016.
- 42% (44 out of 105) of the women invited in 2016 were invited again for this cycle.
- 36% (38 out of 105) of the men invited in 2016 were invited again for this cycle.
Which club teams have the most representation at tryouts?
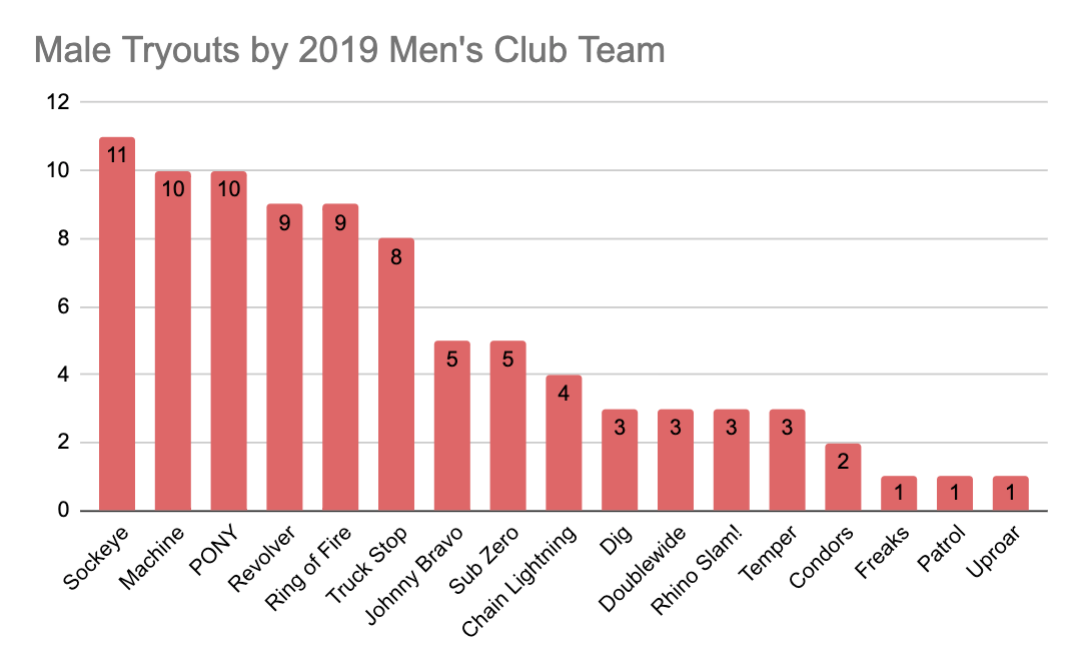
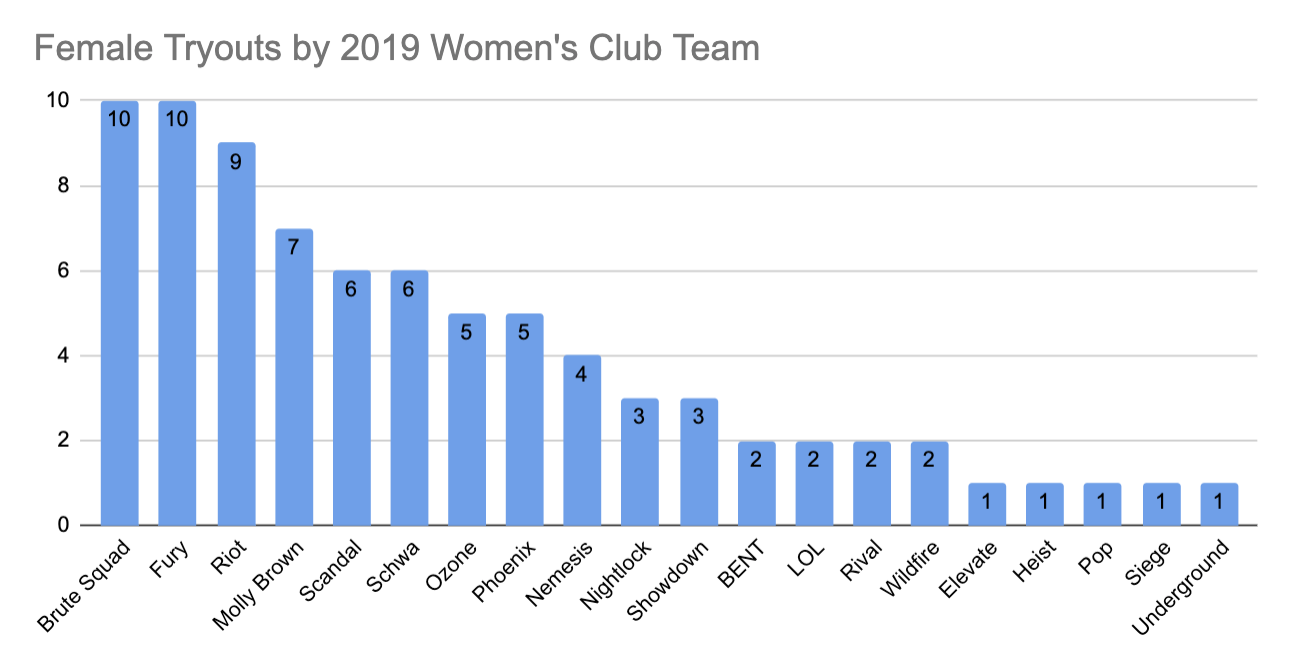
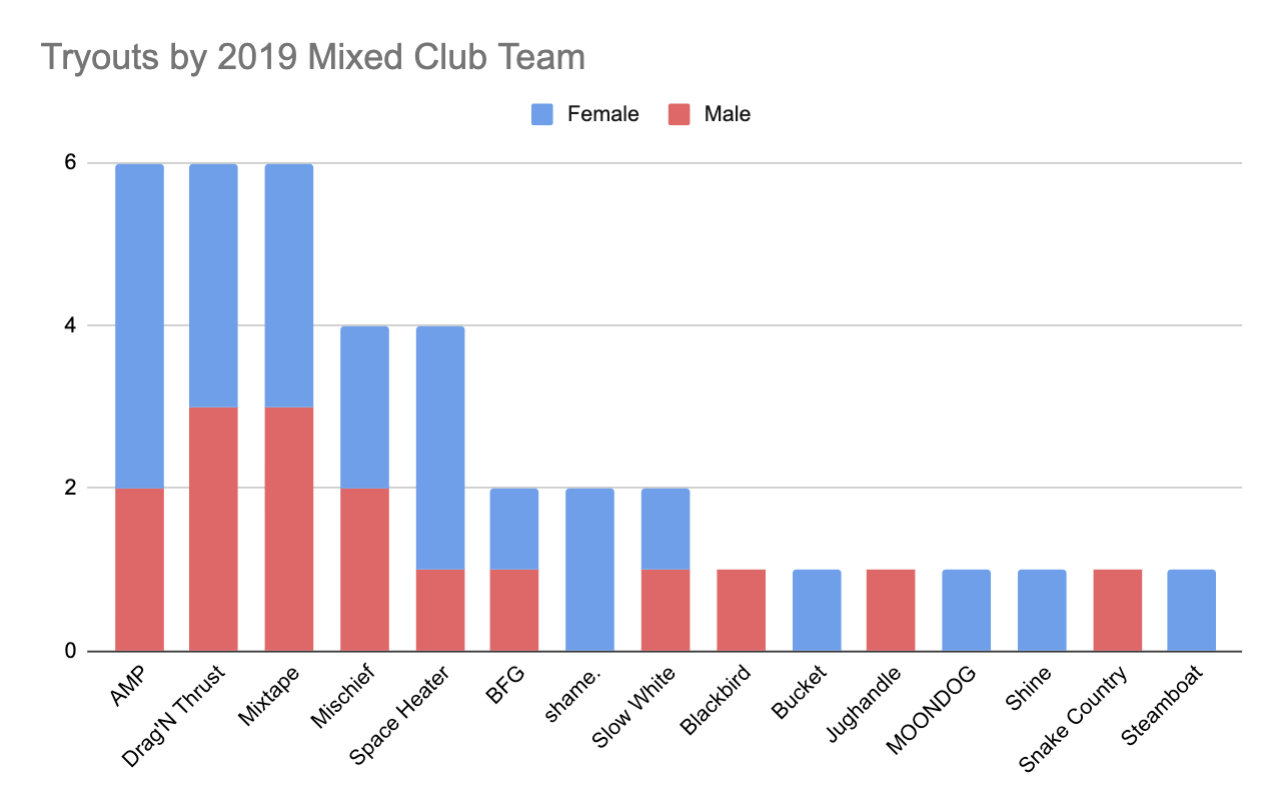
Here are all the teams on a single chart:
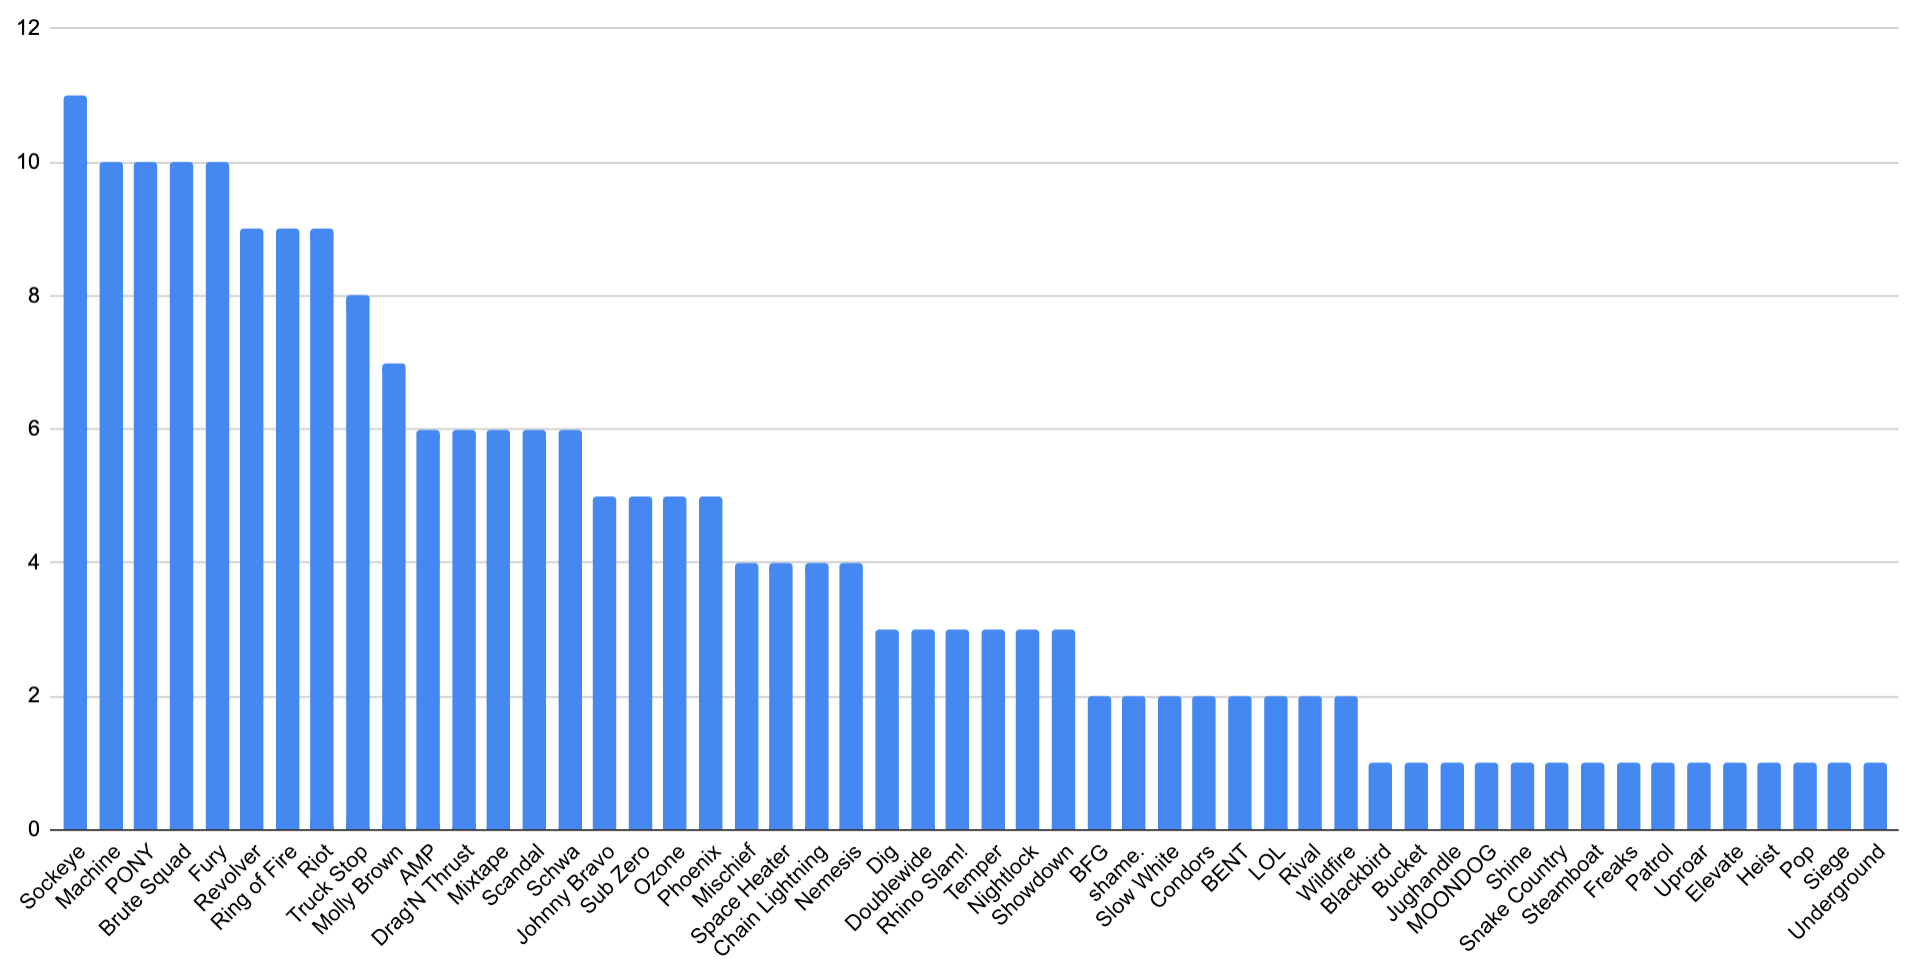
How are geographic regions represented?
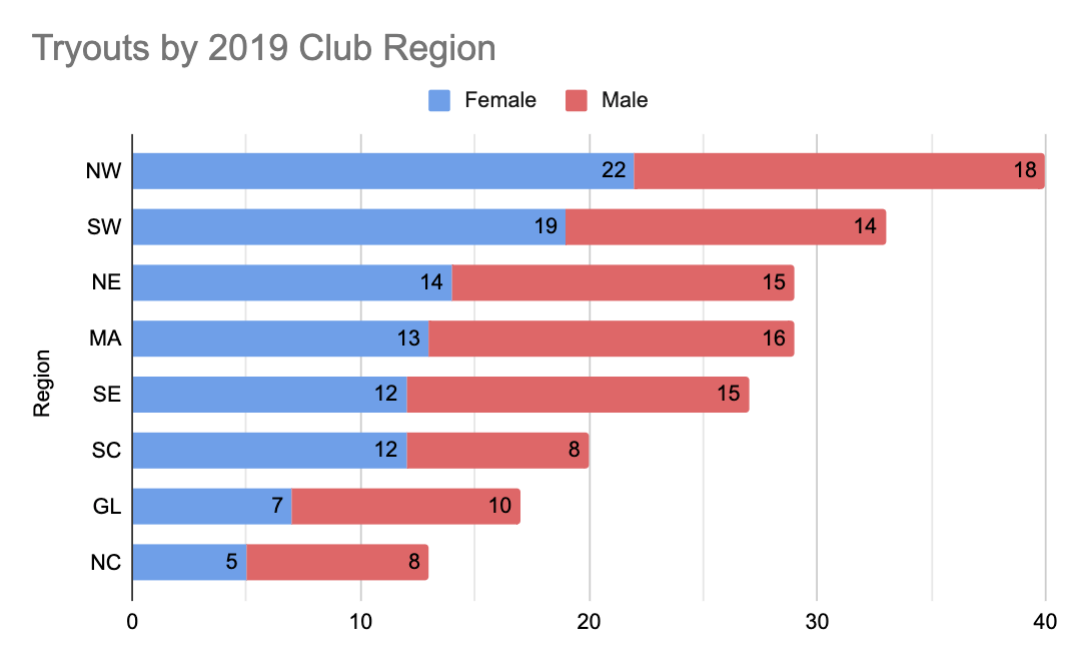
Notes:
- Western regions (NW, SW, SC) got 45% of the invites.
- Eastern regions (NE, MA, SE) got 41% of the invites.
- Central regions (GL, NC) got 14% of the invites.
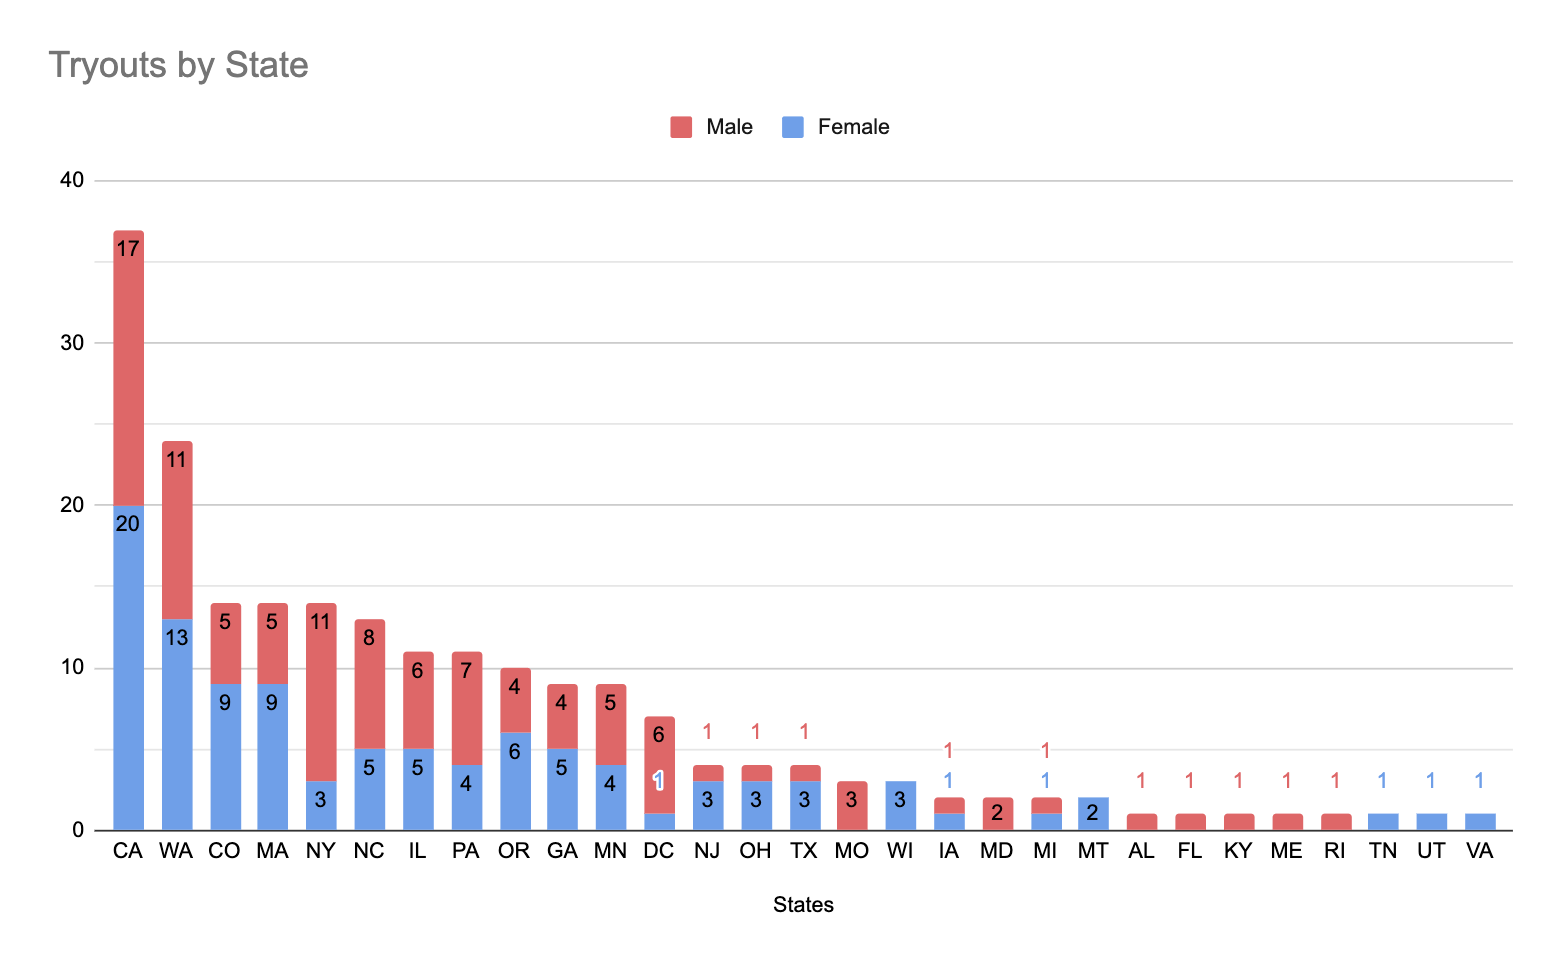
How are individual states represented?1
Here is a heat map of the country: darker states represent a higher number of tryouts.
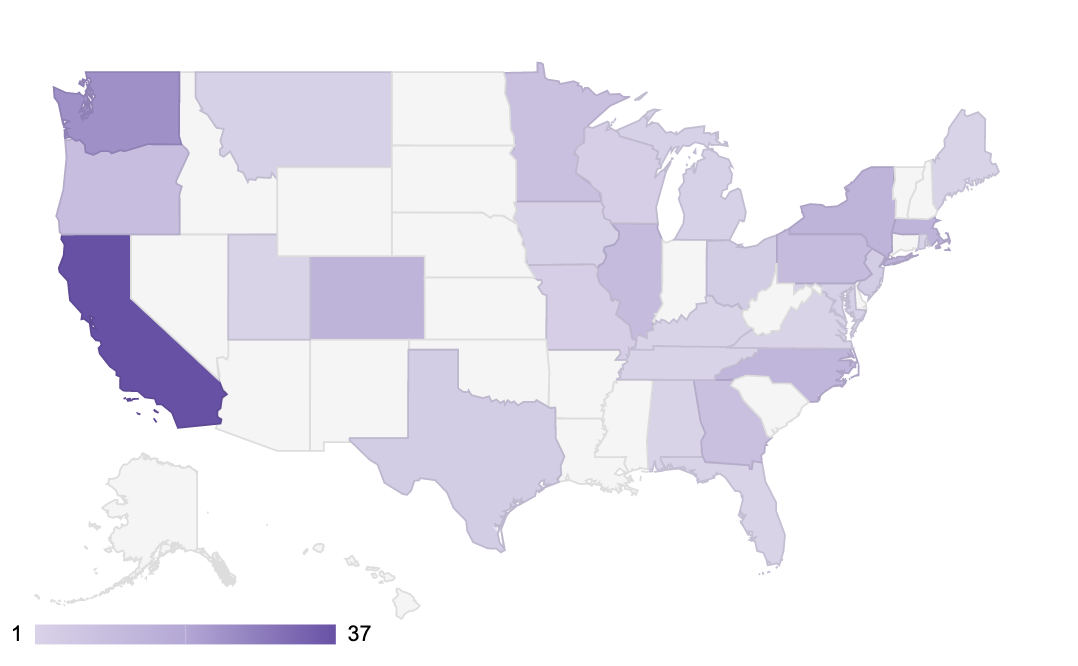
Notes:
- The two most highly represented states — California and Washington — got 29% of the invites.
- The top five states combined got just under half of the invites.
- Just 29 of the 50 states had players that received invites.
Note that these are based on the location of players, not teams ↩