A look at the roster composition of this year's U24 U.S. National teams, and some comparisons to teams past.
July 2, 2019 by Charlie Enders in Analysis
Ultiworld’s coverage of U24 Worlds is presented by VC Lookfly; all opinions are those of the author. Please support the brands that make Ultiworld possible and shop at VC Lookfly!
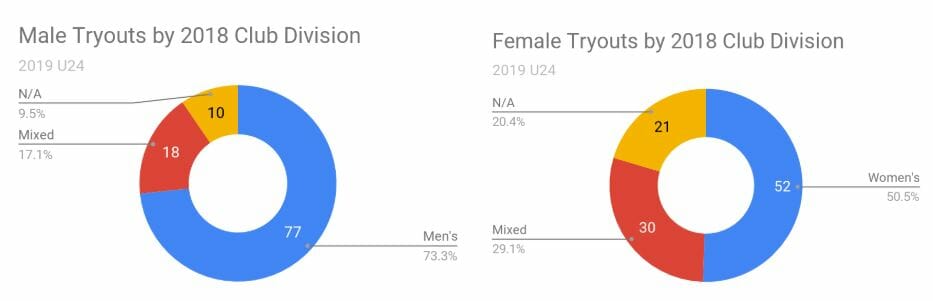
Every couple of years, many of the best young players in the country go through the process of attempting to represent the United States at the WFDF U24 World Championships. The increasingly competitive international event is a bright stage for college-aged (and even some high school) players looking to prove themselves among the best. The tryout process whittled down over 550 applicants in 2019 to 74 athletes across the men’s, women’s, and mixed division rosters.
This year’s cohort are headed to Heidelberg, Germany to compete starting July 13th. All three squads enter as defending gold medalists, the favorites and boogeymen of their divisions. But we’re more focused on who makes up these teams and what the numbers show us about their roster composition.
Disclaimers
I’m an amateur statistician. I took one semester of Statistics in college, but aside from that have no formal training on it. If you’re looking for extremely nuanced analysis of the numbers, with chi-squared tests and regression analysis and the Pearson product-moment correlation coefficient, sadly I can’t provide that. What I can provide is fairly shallow observations about data that I acquired through excruciating amounts of googling.
For simplicity sake, I’m splitting the mixed team into their respective genders. I’m also only counting Club teams that made regionals. I realize that 2013 and 2015 were U23, not U24. But that’s a difference in name only, as the age parameters have been the same throughout the tournaments existence. Thus, I’m just going to refer to it as U24 throughout the article. Do you care? You don’t care.
This Year’s Teams
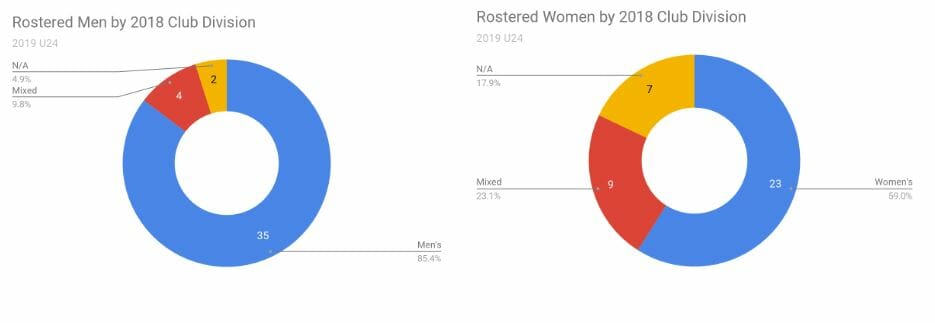
- No real surprises here, with mixed in the minority for both sides. As to why most young elite talent sticks to single-gender club? That’s a whole separate article.
- The women’s distribution is more diverse, with 60% of the final roster on single gender club teams vs 84% for men.
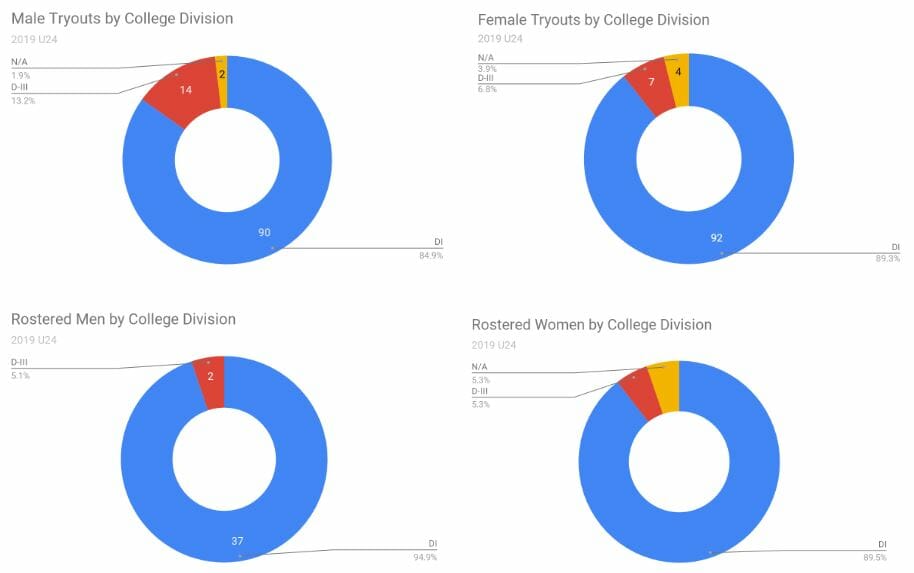
- D-III players comprised a small percentage of the tryouts, and an even smaller percentage of the roster. While the gap between D-I and D-III has gotten smaller in recent years, on the whole D-I ultimate is faster, deeper, and more competitive.
- Top D-I schools also are a bigger draw to many of the best coaches in the country, meaning many of the D-I tryouts have the added benefit of years of coaching and learning a system. I wish I had statistics on the number of coaches in D-I vs. D-III, but it’s safe to say they are more prevalent at the bigger schools. This also means they tend to be more familiar to coaches and evaluating personnel, which can’t hurt.

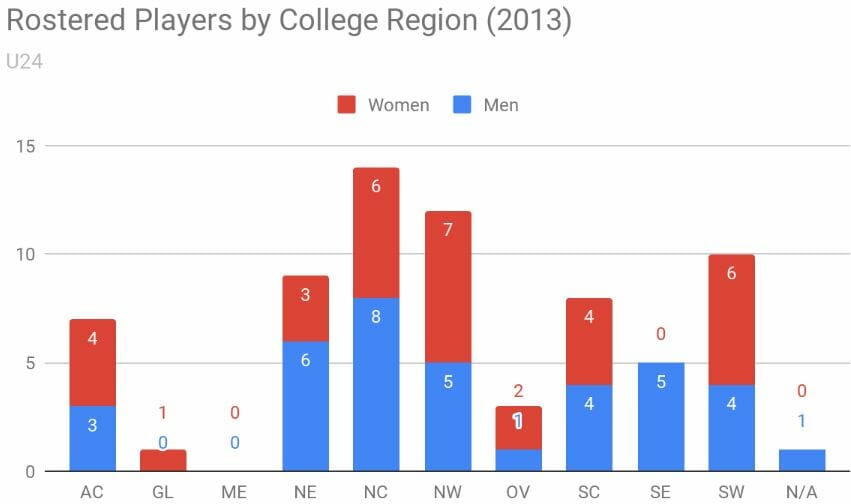
- On the whole, the women are much more evenly dispersed among the regions than the men.
- The South Central’s percentage is among the worst (14.29%), despite being the largest group at tryouts. “USAU hates the SC” conspiracy theorists, assemble!
- The Dartmouth-dominated New England contingent (66.67%), the Northwest (54.55%), and the Ohio Valley (46.15%) are the leading regions percentage-wise.
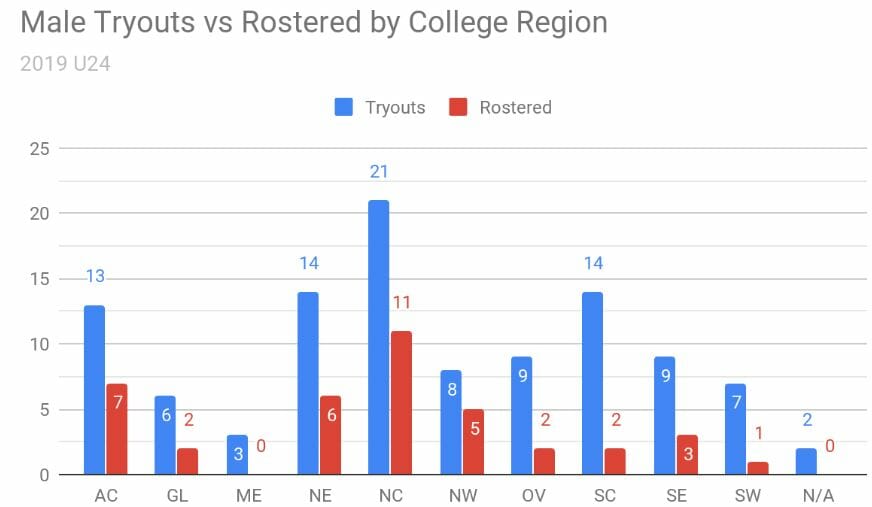
- With such a huge contingent of Carleton players, the North Central leading in both categories isn’t too surprising.
- The top three regions percentage-wise are the Northwest (62.5%), the Atlantic Coast (58.35%), and the North Central (52.38%).
- Despite being tied for the second most tryouts, the South Central men only ended up with two players on the team (Alan Villanueva & late-addition Quinn Finer), a paltry 14.29% (SW is the same, but with half the number of tryouts).
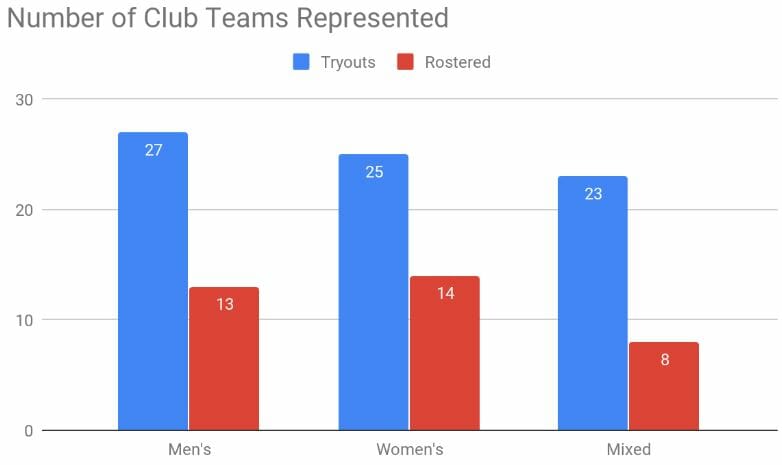
- A club team is considered represented if at least one player from its 2018 roster is on the corresponding list.
- If you’re interested in percentages, 48.15% of Men’s teams represented at tryouts are also represented on the final roster, along with 56% of Women’s teams, and 34.78% of Mixed teams
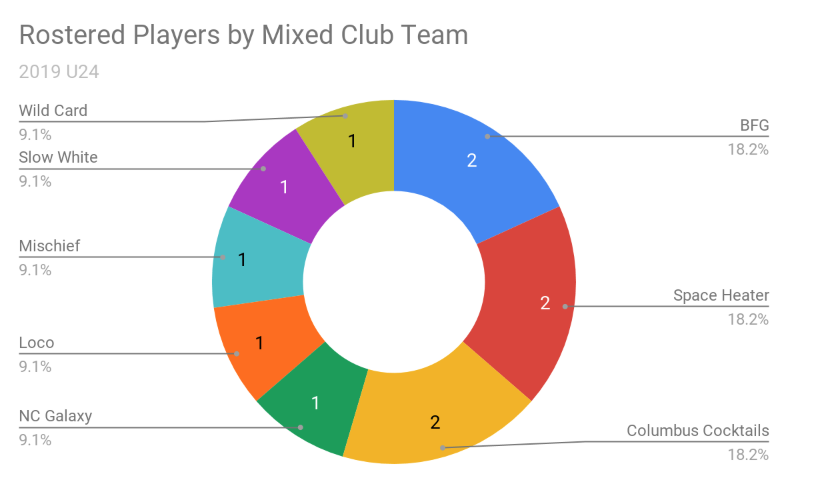
- Of the eight mixed club teams represented, three — Boston Wild Card (Luke Webb), North Carolina Galaxy (Walker Matthews) and West Chester Loco (Lindsay McKenna) — failed to qualify for Nationals last fall.
- Nine of the players from mixed club teams are women, versus just four men.
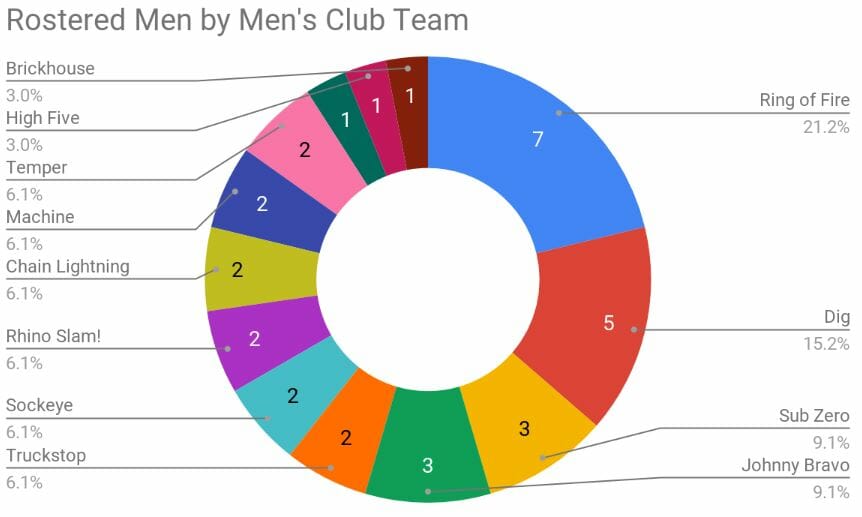
- It shouldn’t surprise anyone that Ring of Fire tops the list since many of the top players from CUT and Darkside are from the Triangle area.1
- Absent from the list is Revolver, given that their youngest players (John Stubbs, Lior Givol, Sawyer Thompson) aged out after last cycle.
- Only one team represented failed to qualify for Club Nationals in 2018: Durham Brickhouse, UNCW’s Rick Hennighausen’s team. After suffering a midseason injury, Hennighausen was replaced on the National team roster.
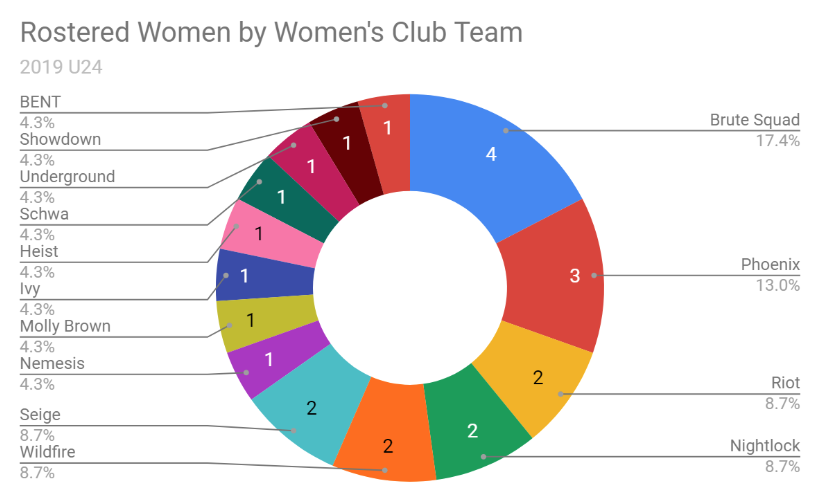
- Five teams represented here failed to qualify for Nationals in 2018: Ivy, Siege, Underground, Showdown, and BENT.
- All four Brute Squad players that tried out for U24 made the team (Lee, Zhu, Werffelli, and Wilson).
Annoyingly, at least for data purposes, 2018 U24 is a bit of an anomaly. While the tournament itself took place in 2018 (due to “seasonal issues” in Perth), I’m going to treat it like the tournament happened on its typical schedule. The school year used throughout this data is the year in which the tryouts took place; for the 2018 team, that means we use the 2016-2017 college season. Yes, technically there were a lot of people on the 2018 team that weren’t in college anymore when the tournament took place. But if we assumed the tourney had not taken place in Australia and adhered to its normal schedule, the data is much more comparable and thus, useful.
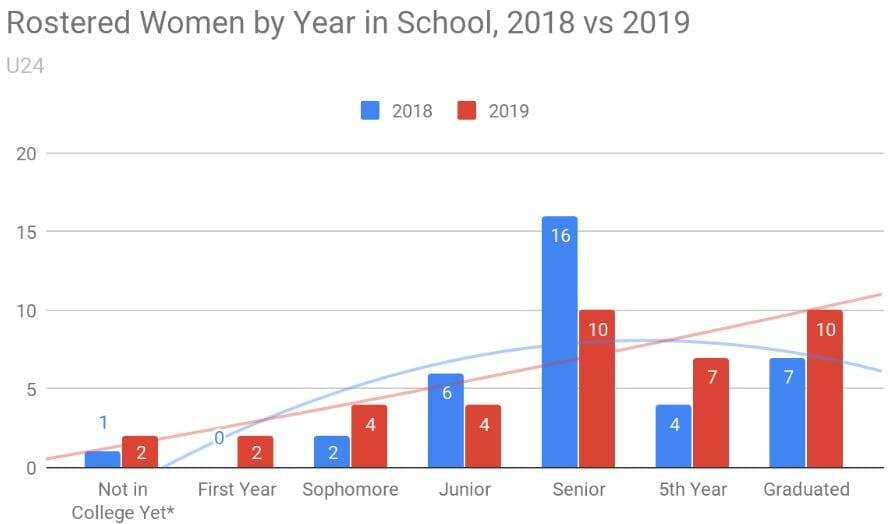
In a perfect world, there’d be a simple process of going to the USAU website and looking up information about our national teams (at the very least), but sadly there is not. Instead, I assigned each player a numerical value where Senior/Grad is 5 (since some players forego their fifth year of eligibility, they tend to be of similar age), Senior is 4, Junior is 3, Sophomore is 2, First Year is 1, and High School is 0, and got an average year in school, or AYS for short.

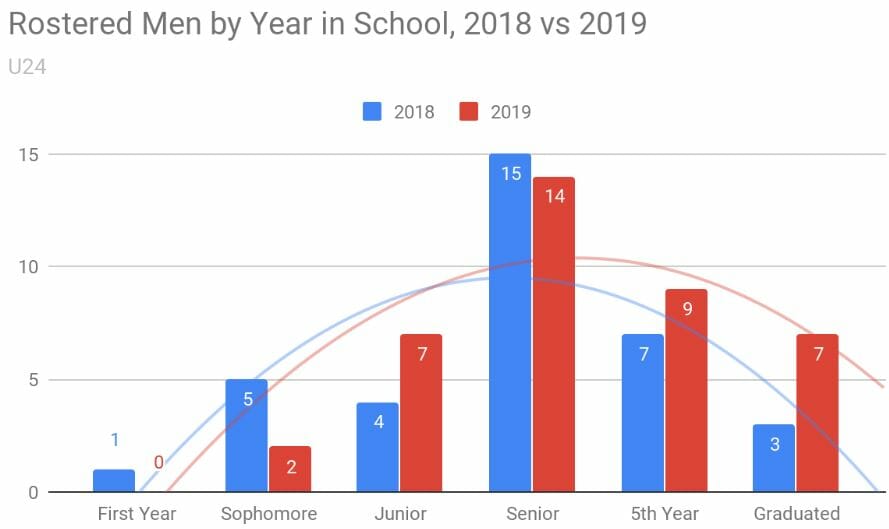
- The men tend to be slightly older on average (mostly due to the old folks home that was the 2015 men’s team), but on the whole the teams are pretty consistent.
- Typically, seniors make up the bulk of the squad.


- The Pittsburgh men dominated the roster in 2018, with their five members ranking the most from any one school on the men’s side. The next closest were Carleton (4) and UMass (3).
- The Northwest women comprised the largest portion of the women, with Whitman (4) leading the way. The most by a single school on the women’s side, however was (unsurprisingly) Dartmouth (5).
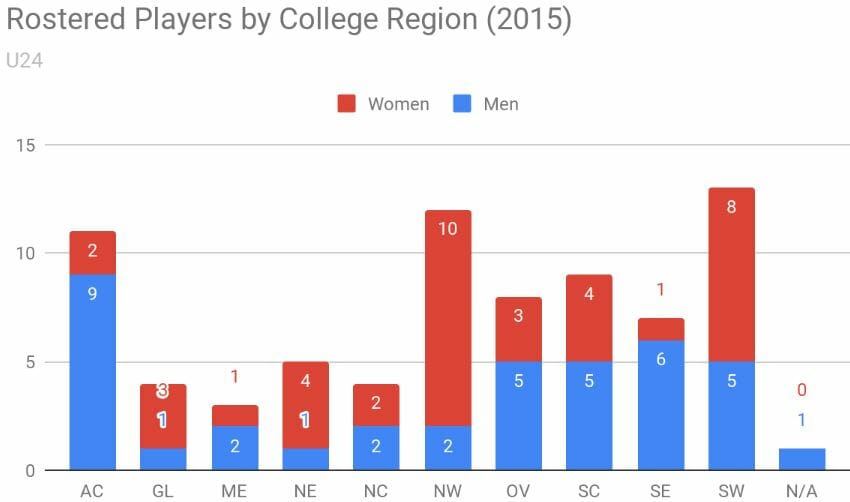
- Again, the Northwest women led the pack back in 2015, this time closely followed by the Southwest. Oregon’s powerful core led all schools this time, with four players on the roster.
- The Atlantic Coast established itself as a bastion of men’s excellence back in 2015, with UNC’s first championship. The players that led that squad (Nethercutt, Snell, McCallister, and Zuraw) translated that collegiate success to U24.
- The inaugural squad was fronted on both sides by the New England, North Central, Northwest, and Southwest regions. Those four regions make up 70% of all rostered players.
- Meanwhile, the Great Lakes, Metro East, Ohio Valley, and Southeast make up a meager 12.86%.
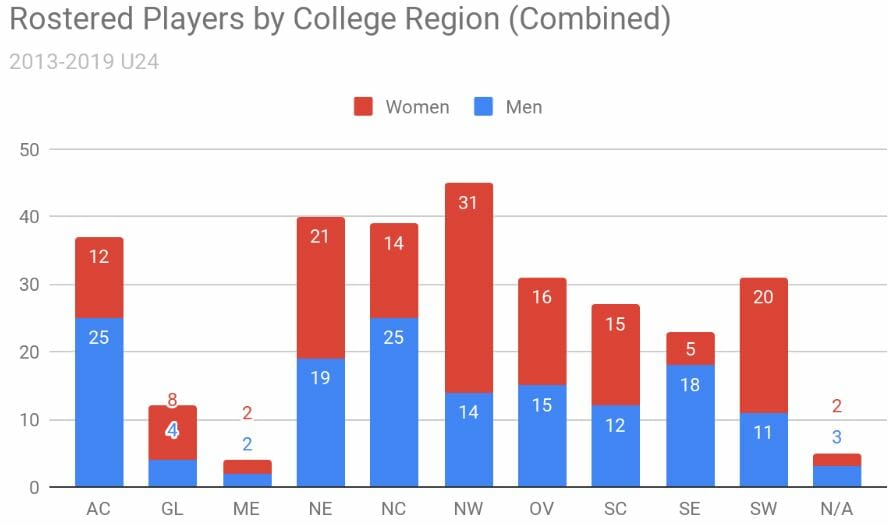
The story here is less about the regions at the top and more about those at the bottom. The Great Lakes and Metro East regions are dramatically below every other region- the next closest (Southeast) has seven more than those two combined. For the most part, this makes sense. The Metro East’s struggles on both the men’s and women’s sides are well-documented. The Great Lakes, meanwhile, has a respectable eight women, while the men have a paltry four. This also adds up: since 2014, the Great Lakes has sent more than one team to Nationals only once, in 2014 (when they sent two). Is there a correlation between number of bids to Nationals and number of players on National teams? Probably, but this article is long enough as it is.
What do you see in the numbers? Comment below!
Henry Fisher, Sol Yanuck, Dillon Lanier, Eric Taylor, Matt Gouchoe-Hanas, Elijah Long, and Liam Searles-Bohs ↩