Putting New York's historical offensive game in statistical perspective, plus playoff stats for each player!
August 21, 2023 by Paul Würtztack in Analysis
Before we turn to individual stats for each of the four divisional playoff games, a few notes on the Empire’s record-breaking evening of efficiency:
- The 24 goal, 4 turnover performance was actually better than that; as Evan Lepler indicated, one of those four turns was a Ryan Osgar 3rd-quarter Qinc.1 In BBSM’s scorebook, the Empire had just three turns for an efficiency of 88.9 percent.
- Over the last three seasons, the previous single-team, full-game efficiency mark was Chicago’s 33 goal, 7 turn performance (82.5%) in 2022, followed by Atlanta’s 27 goal, 6 turn effort in 2021 (81.8%).2 In neither game was the opponent one of the best teams in the league, as DC was; Chicago beat winless Detroit, and Atlanta beat 1-11 Pittsburgh.
- DC also had a Qinc (Rowan, 1st quarter), and so we have them down for 19 goals and 9 turns, nearly identical to their 19-goal, 8-turn performance against Boston in their previous game. It’s just that instead of winning by seven, they lost by five.
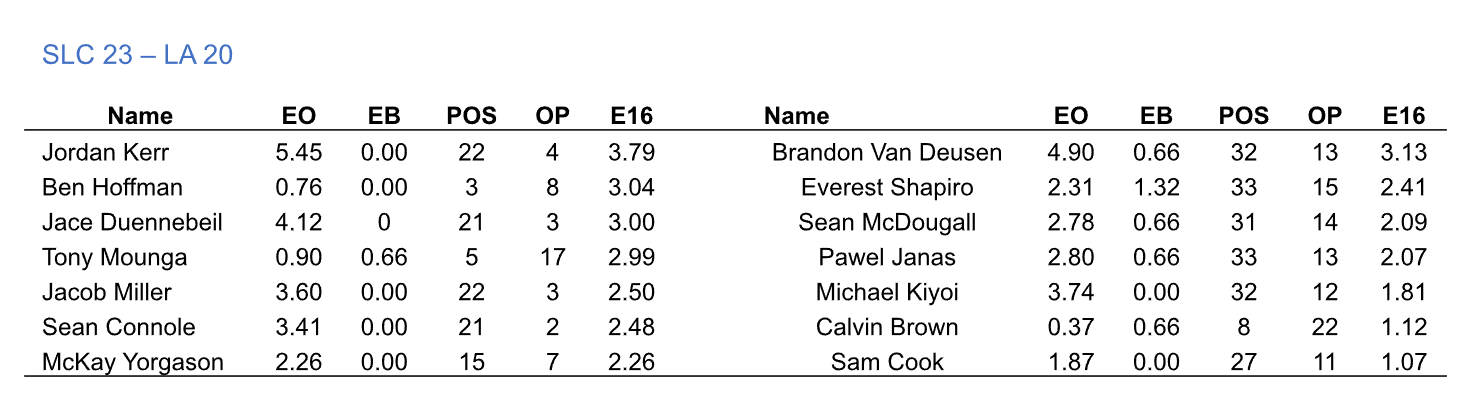
- The Empire masterpiece overshadowed what, in most any other week, would have been the standout team performance—the Shred’s 23-goal, 9-turn (72% SE) win over LA.
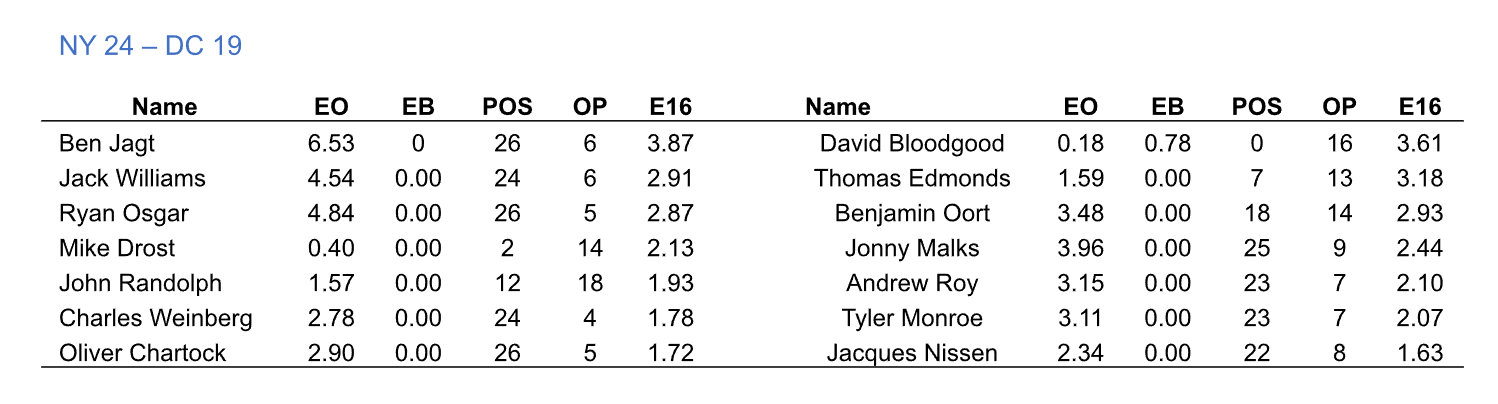
And now to the individual performances, and who could have guessed that Ben Jagt, Ryan Osgar, and Playoff Jack would occupy three of the top spots? Or that Jagt would lead the field by a healthy margin?
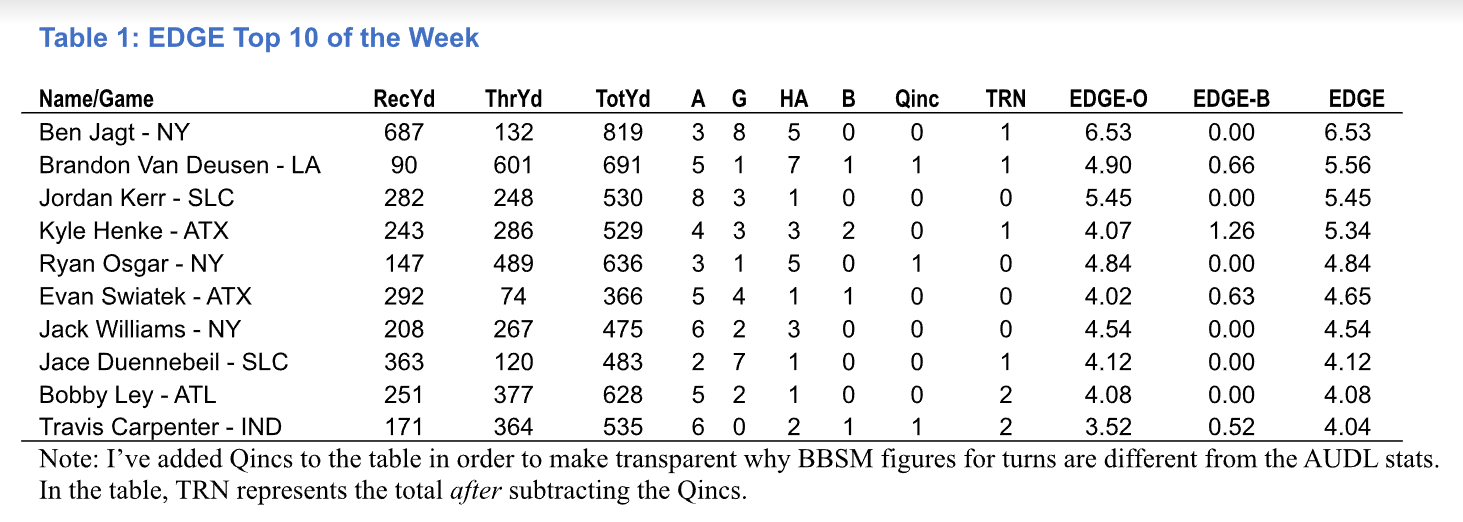
Quick hits, before we get back to Jagt:
- Jordan Kerr notched his first 5+ game of the year. After a regular season of consistently high EDGE scores, Kerr’s first playoff game was his best (so far) this year.
- Same for Kyle Henke, who blew by his previous season high 3.80 with a 5.34 EDGE score that still may undercount his importance to the outcome of that game.
- Brandon Van Deusen led the weekend in throwing yardage with 601, capping off a great season in which he averaged 4.67 EDGE per game over his last 3 games.
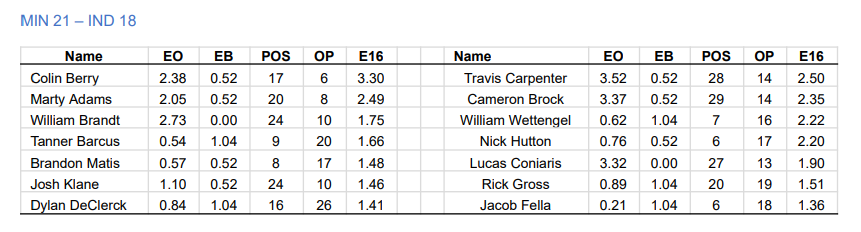
- Minnesota’s production was so well distributed that Colin Berry’s team-high EDGE was only the 27th highest of the weekend.
Back to Jagt. So dominant was he as a target in the DC game that Charlie speculated it may be the top EDGE score of the season. In fact, it was only the 8th highest, but it would have been the highest if not for Jagt’s one throwaway. Turns are costly—particularly in the DC game—and if you look at the list of the seven EDGE scores higher than Jagt’s, you’ll see that in each case but one the player neutralized the cost of any turns with at least as many blocks; the lone exception is Mac Hecht, the only player to go for more than 1000 total yards in a game this year.
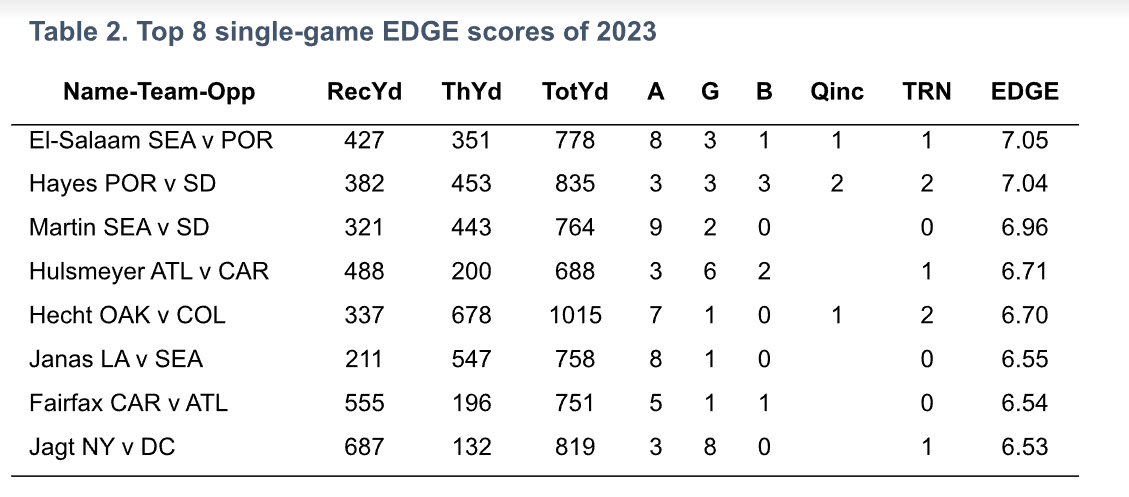
As a side note, only one of these performances—the Garrett Martin game—was among the top 8 of the year in +/-, and it was the only one in the +/- top 8 in which a player threw for more yards than he received. That the +/- list is dominated by cutting performances is partly because of the anti-throwing bias, partly because of counting Qincs as turns. The EDGE top 8 list is split 50-50. But I digress.
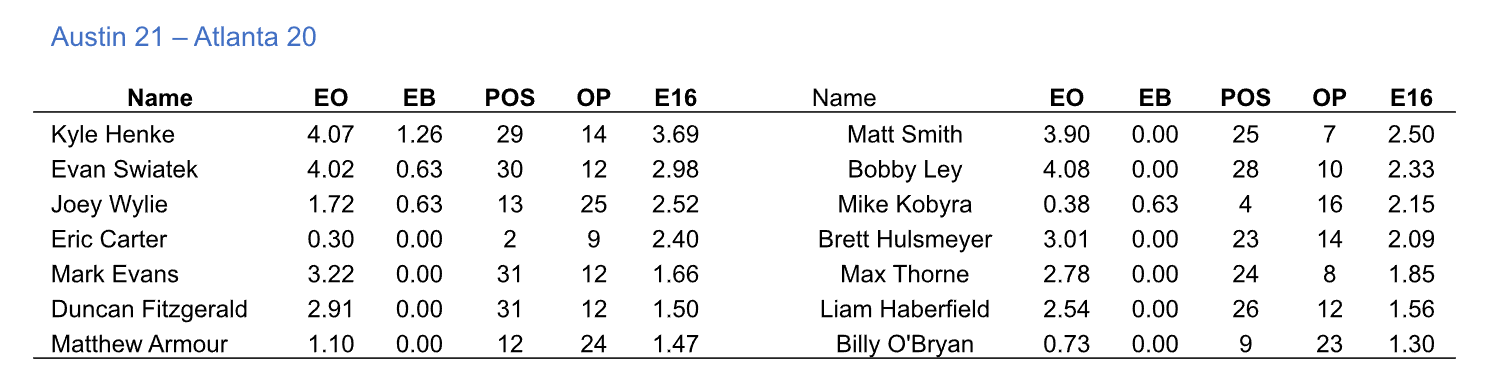
Game Lines for Divisional Championship Games
For a look at each of the Division Championship games, I’ve decided to present a Game Line, the seven players of each team with the top E16. However, we’re tweaking E16. I had thought the blended version reintroduced last week would be a better assessor of single-game productivity, but upon further review, I don’t think that’s the case, and that the original E100 methodology is more reliable in accommodating the fundamental problem of small sample sizes, with two tweaks.
The first of course is to likewise change the scale to 16 possessions instead of 100, about the average for all players in an AUDL game. D-line players typically have fewer possessions than O-line players, so if we want to compare them on the same scale, D-line players may often get a bit of extrapolation boost. That is, an EDGE score derived over 24 possessions is more confidently scaled to 16 possessions than an EDGE score derived from 2 possessions.
The second tweak is related to this and gets an introduction care of DC’s David Bloodgood.3 So clinical was NY’s offense that five DC D-line regulars, playing an average of 14 points each, ended the game without a single possession. One of them was Bloodgood, but that didn’t stop him from scoring; he simply nabbed a callahan (from the centering pass off his own pull, no less). In order to make the math work, we have to give Bloodgood a possession; following from this, in an effort to rein in small-sample extremism, the second tweak is to build in one additional possession and opponent possession in the calculation, similar to turnover adjustments made in Completion Percentage Plus (CP+). The formula for E16 is in the Legend at the end.
Bloodgood still gets a very high E16 in this unique case, but this is an extreme example, and for the most part, such weirdness is kept in check. And such an outlier can also reveal key parts of the game’s dynamic; Bloodgood’s result gives us a feel for just how valuable a D-line block and score was in this game (and that callahans are a very cool component of ultimate).
Per the results below, E16 will typically include the several top EDGE producers of the game, but also 2 or 3 D-liners whose per-possession productivity is comparable, as intended. Interpret the results with some care. It’s not meaningful to say that Tony Mounga had a “better” game than Jacob Miller or Sean McDougall, but we can appreciate that Mounga produced at a higher rate over a smaller number of possessions.
Sortable results for EDGE, E16, and other metrics for the Division Championship games are available in the full table at the end.
Table 2. “Game Lines” for each of the Division Championship games, based on E16. Tables show EDGE-O (EO), EDGE-B (EB), possessions (POS), and opponent possessions (OP).
Full Division Championship Week Table
| Name | Team | Opponent | Week | OPP | DPP | ThrYds | RecYds | TotYds | AST | GLS | HA | BLK | ThrErr | Stall | Drop | Qinc | TRN | Net | AH+/- | GameSE | EDGE-O | EDGE-B | EDGE | CHS | ODS | POS | OppPos | EO16 | EB16 | E16 |
|---|---|---|---|---|---|---|---|---|---|---|---|---|---|---|---|---|---|---|---|---|---|---|---|---|---|---|---|---|---|---|
| Ben Jagt - NY | NY | DC | 15 | 21 | 5 | 132 | 687 | 819 | 3 | 8 | 5 | 0 | 1 | 0 | 0 | 0 | 1 | 15 | 10 | 0.78 | 6.53 | 0 | 6.53 | 16 | 19 | 26 | 6 | 3.87 | 0.00 | 3.87 |
| Brandon Van Deusen - LA | LA | SLC | 15 | 22 | 2 | 601 | 90 | 691 | 5 | 1 | 7 | 1 | 2 | 0 | 0 | 1 | 1 | 13 | 5 | 0.66 | 4.9 | 0.66 | 5.56 | 87 | 8 | 32 | 13 | 2.38 | 0.75 | 3.13 |
| Jordan Kerr - SLC | SLC | LA | 15 | 20 | 2 | 248 | 282 | 530 | 8 | 3 | 1 | 0 | 0 | 0 | 0 | 0 | 0 | 12 | 11 | 0.66 | 5.45 | 0.00 | 5.45 | 47 | 9 | 22 | 4 | 3.79 | 0.00 | 3.79 |
| Kyle Henke - ATX | ATX | ATL | 15 | 20 | 5 | 286 | 243 | 529 | 4 | 3 | 3 | 2 | 1 | 0 | 0 | 0 | 1 | 11 | 8 | 0.63 | 4.07 | 1.26 | 5.34 | 54 | 20 | 29 | 14 | 2.17 | 1.34 | 3.51 |
| Ryan Osgar - NY | NY | DC | 15 | 21 | 4 | 489 | 147 | 636 | 3 | 1 | 5 | 0 | 1 | 0 | 0 | 1 | 0 | 9 | 3 | 0.78 | 4.84 | 0.00 | 4.84 | 77 | 16 | 26 | 5 | 2.87 | 0.00 | 2.87 |
| Evan Swiatek - ATX | ATX | ATL | 15 | 22 | 4 | 74 | 292 | 366 | 5 | 4 | 1 | 1 | 0 | 0 | 0 | 0 | 0 | 11 | 10 | 0.63 | 4.02 | 0.63 | 4.65 | 20 | 15 | 30 | 12 | 2.07 | 0.78 | 2.85 |
| Jack Williams - NY | NY | DC | 15 | 19 | 6 | 267 | 208 | 475 | 6 | 2 | 3 | 0 | 0 | 0 | 0 | 0 | 0 | 11 | 8 | 0.78 | 4.54 | 0.00 | 4.54 | 56 | 24 | 24 | 6 | 2.91 | 0.00 | 2.91 |
| Jace Duennebeil - SLC | SLC | LA | 15 | 21 | 0 | 120 | 363 | 483 | 2 | 7 | 1 | 0 | 1 | 0 | 0 | 0 | 1 | 9 | 8 | 0.66 | 4.12 | 0 | 4.12 | 25 | 0 | 21 | 3 | 3.00 | 0.00 | 3.00 |
| Bobby Ley - ATL | ATL | ATX | 15 | 22 | 4 | 377 | 251 | 628 | 5 | 2 | 1 | 0 | 2 | 0 | 0 | 0 | 2 | 6 | 5 | 0.63 | 4.08 | 0.00 | 4.08 | 60 | 15 | 28 | 10 | 2.25 | 0.00 | 2.25 |
| Travis Carpenter - IND | IND | MIN | 15 | 19 | 3 | 364 | 171 | 535 | 6 | 0 | 2 | 1 | 3 | 0 | 0 | 1 | 2 | 7 | 4 | 0.52 | 3.52 | 0.52 | 4.04 | 68 | 14 | 28 | 14 | 1.94 | 0.55 | 2.50 |
| Jonny Malks - DC | DC | NY | 15 | 23 | 1 | 466 | 312 | 778 | 5 | 2 | 4 | 0 | 3 | 0 | 0 | 0 | 3 | 8 | 4 | 0.78 | 3.96 | 0.00 | 3.96 | 60 | 4 | 25 | 9 | 2.44 | 0.00 | 2.44 |
| Matt Smith - ATL | ATL | ATX | 15 | 19 | 4 | 186 | 247 | 433 | 3 | 3 | 2 | 0 | 0 | 0 | 0 | 0 | 0 | 8 | 6 | 0.63 | 3.9 | 0.00 | 3.90 | 43 | 17 | 25 | 7 | 2.40 | 0.00 | 2.40 |
| Cameron Brock - IND | IND | MIN | 15 | 20 | 3 | 57 | 293 | 350 | 2 | 4 | 2 | 1 | 0 | 0 | 0 | 0 | 0 | 9 | 7 | 0.52 | 3.37 | 0.52 | 3.89 | 16 | 13 | 29 | 14 | 1.80 | 0.55 | 2.35 |
| Michael Kiyoi - LA | LA | SLC | 15 | 22 | 2 | 208 | 229 | 437 | 1 | 4 | 2 | 0 | 0 | 0 | 0 | 0 | 0 | 7 | 5 | 0.66 | 3.74 | 0.00 | 3.74 | 48 | 8 | 32 | 12 | 1.81 | 0.00 | 1.81 |
| Everest Shapiro - LA | LA | SLC | 15 | 23 | 4 | 76 | 241 | 317 | 1 | 4 | 0 | 2 | 0 | 1 | 0 | 0 | 1 | 6 | 6 | 0.66 | 2.31 | 1.32 | 3.63 | 24 | 15 | 33 | 15 | 1.09 | 1.32 | 2.41 |
| Jacob Miller - SLC | SLC | LA | 15 | 21 | 1 | 267 | 177 | 444 | 2 | 2 | 3 | 0 | 0 | 0 | 0 | 0 | 0 | 7 | 4 | 0.66 | 3.6 | 0.00 | 3.60 | 60 | 5 | 22 | 3 | 2.50 | 0.00 | 2.50 |
| Benjamin Oort - DC | DC | NY | 15 | 17 | 7 | 230 | 195 | 425 | 4 | 0 | 1 | 0 | 0 | 0 | 0 | 0 | 0 | 5 | 4 | 0.78 | 3.48 | 0.00 | 3.48 | 54 | 29 | 18 | 14 | 2.93 | 0.00 | 2.93 |
| Pawel Janas - LA | LA | SLC | 15 | 23 | 2 | 412 | 335 | 747 | 6 | 1 | 3 | 1 | 5 | 0 | 0 | 0 | 5 | 6 | 3 | 0.66 | 2.8 | 0.66 | 3.46 | 55 | 8 | 33 | 13 | 1.32 | 0.75 | 2.07 |
| Sean McDougall - LA | LA | SLC | 15 | 22 | 4 | 143 | 321 | 464 | 2 | 4 | 3 | 1 | 2 | 0 | 0 | 0 | 2 | 8 | 5 | 0.66 | 2.78 | 0.66 | 3.44 | 31 | 15 | 31 | 14 | 1.39 | 0.70 | 2.09 |
| Sean Connole - SLC | SLC | LA | 15 | 20 | 1 | 196 | 189 | 385 | 2 | 3 | 1 | 0 | 0 | 0 | 0 | 0 | 0 | 6 | 5 | 0.66 | 3.41 | 0.00 | 3.41 | 51 | 5 | 21 | 2 | 2.48 | 0.00 | 2.48 |
| Lucas Coniaris - IND | IND | MIN | 15 | 18 | 2 | 327 | 125 | 452 | 2 | 3 | 1 | 0 | 1 | 0 | 0 | 0 | 1 | 5 | 4 | 0.52 | 3.32 | 0.00 | 3.32 | 72 | 10 | 27 | 13 | 1.90 | 0.00 | 1.90 |
| Mark Evans - ATX | ATX | ATL | 15 | 22 | 4 | 258 | 224 | 482 | 2 | 2 | 3 | 0 | 2 | 0 | 0 | 1 | 1 | 6 | 2 | 0.63 | 3.22 | 0.00 | 3.22 | 54 | 15 | 31 | 12 | 1.61 | 0.00 | 1.61 |
| Andrew Roy - DC | DC | NY | 15 | 21 | 1 | 247 | 155 | 402 | 1 | 2 | 3 | 0 | 0 | 0 | 0 | 0 | 0 | 6 | 3 | 0.78 | 3.15 | 0.00 | 3.15 | 61 | 5 | 23 | 7 | 2.10 | 0.00 | 2.10 |
| Tyler Monroe - DC | DC | NY | 15 | 22 | 0 | 125 | 221 | 346 | 4 | 5 | 0 | 0 | 1 | 0 | 0 | 0 | 1 | 8 | 8 | 0.78 | 3.11 | 0.00 | 3.11 | 36 | 0 | 23 | 7 | 2.07 | 0.00 | 2.07 |
| Brett Hulsmeyer - ATL | ATL | ATX | 15 | 18 | 7 | 105 | 385 | 490 | 3 | 3 | 1 | 0 | 0 | 0 | 2 | 0 | 2 | 5 | 4 | 0.63 | 3.01 | 0.00 | 3.01 | 21 | 28 | 23 | 14 | 2.01 | 0.00 | 2.01 |
| Duncan Fitzgerald - ATX | ATX | ATL | 15 | 22 | 4 | 338 | 108 | 446 | 3 | 4 | 3 | 0 | 2 | 0 | 0 | 0 | 2 | 8 | 5 | 0.63 | 2.91 | 0.00 | 2.91 | 76 | 15 | 31 | 12 | 1.46 | 0.00 | 1.46 |
| Colin Berry - MIN | MIN | IND | 15 | 14 | 3 | 79 | 204 | 283 | 0 | 3 | 1 | 1 | 0 | 0 | 0 | 0 | 0 | 5 | 4 | 0.52 | 2.38 | 0.52 | 2.90 | 28 | 18 | 17 | 6 | 2.12 | 1.19 | 3.30 |
| Oliver Chartock - NY | NY | DC | 15 | 21 | 4 | 115 | 220 | 335 | 2 | 2 | 1 | 0 | 0 | 0 | 0 | 0 | 0 | 5 | 4 | 0.78 | 2.9 | 0.00 | 2.90 | 34 | 16 | 26 | 5 | 1.72 | 0.00 | 1.72 |
| Max Thorne - ATL | ATL | ATX | 15 | 19 | 3 | 155 | 133 | 288 | 1 | 4 | 3 | 0 | 0 | 0 | 0 | 0 | 0 | 8 | 5 | 0.63 | 2.78 | 0.00 | 2.78 | 54 | 14 | 24 | 8 | 1.78 | 0.00 | 1.78 |
| Charles Weinberg - NY | NY | DC | 15 | 19 | 4 | 112 | 147 | 259 | 2 | 4 | 2 | 0 | 0 | 0 | 0 | 0 | 0 | 8 | 6 | 0.78 | 2.78 | 0.00 | 2.78 | 43 | 17 | 24 | 4 | 1.78 | 0.00 | 1.78 |
| William Brandt - MIN | MIN | IND | 15 | 17 | 2 | 242 | 114 | 356 | 7 | 1 | 1 | 0 | 2 | 0 | 0 | 0 | 2 | 7 | 6 | 0.52 | 2.73 | 0.00 | 2.73 | 68 | 11 | 24 | 10 | 1.75 | 0.00 | 1.75 |
| Solomon Rueschemeyer-Bailey - NY | NY | DC | 15 | 21 | 4 | 263 | 167 | 430 | 3 | 1 | 3 | 0 | 1 | 0 | 0 | 0 | 1 | 6 | 3 | 0.78 | 2.73 | 0.00 | 2.73 | 61 | 16 | 26 | 5 | 1.62 | 0.00 | 1.62 |
| Elliott Chartock - NY | NY | DC | 15 | 21 | 4 | 264 | 36 | 300 | 2 | 2 | 1 | 0 | 0 | 0 | 0 | 0 | 0 | 5 | 4 | 0.78 | 2.67 | 0.00 | 2.67 | 88 | 16 | 26 | 5 | 1.58 | 0.00 | 1.58 |
| Marty Adams - MIN | MIN | IND | 15 | 14 | 1 | 146 | 115 | 261 | 0 | 2 | 2 | 1 | 0 | 0 | 0 | 0 | 0 | 5 | 3 | 0.52 | 2.05 | 0.52 | 2.57 | 56 | 7 | 20 | 8 | 1.56 | 0.92 | 2.49 |
| Liam Haberfield - ATL | ATL | ATX | 15 | 19 | 6 | 133 | 147 | 280 | 1 | 3 | 4 | 0 | 0 | 0 | 0 | 0 | 0 | 8 | 4 | 0.63 | 2.54 | 0.00 | 2.54 | 48 | 24 | 26 | 12 | 1.51 | 0.00 | 1.51 |
| Joey Wylie - ATX | ATX | ATL | 15 | 7 | 19 | 138 | 71 | 209 | 0 | 2 | 2 | 1 | 0 | 0 | 0 | 0 | 0 | 5 | 3 | 0.63 | 1.72 | 0.63 | 2.35 | 66 | 73 | 13 | 25 | 1.97 | 0.39 | 2.35 |
| Jacques Nissen - DC | DC | NY | 15 | 20 | 1 | 312 | 207 | 519 | 2 | 1 | 3 | 0 | 1 | 0 | 1 | 0 | 2 | 4 | 1 | 0.78 | 2.34 | 0.00 | 2.34 | 60 | 5 | 22 | 8 | 1.63 | 0.00 | 1.63 |
| Austin Taylor - ATL | ATL | ATX | 15 | 23 | 3 | 366 | 37 | 403 | 5 | 0 | 4 | 0 | 2 | 0 | 0 | 0 | 2 | 7 | 3 | 0.63 | 2.26 | 0 | 2.26 | 91 | 12 | 28 | 10 | 1.25 | 0.00 | 1.25 |
| McKay Yorgason - SLC | SLC | LA | 15 | 15 | 6 | 205 | 31 | 236 | 4 | 0 | 3 | 0 | 0 | 0 | 0 | 0 | 0 | 7 | 4 | 0.66 | 2.26 | 0.00 | 2.26 | 87 | 29 | 15 | 7 | 2.26 | 0.00 | 2.26 |
| Grant Lindsley - SLC | SLC | LA | 15 | 18 | 6 | 217 | 151 | 368 | 0 | 2 | 2 | 0 | 1 | 0 | 0 | 0 | 1 | 3 | 1 | 0.66 | 2.08 | 0.00 | 2.08 | 59 | 25 | 24 | 11 | 1.33 | 0.00 | 1.33 |
| Rick Gross - IND | IND | MIN | 15 | 12 | 8 | 60 | 101 | 161 | 0 | 2 | 2 | 2 | 0 | 0 | 1 | 0 | 1 | 5 | 3 | 0.52 | 0.89 | 1.04 | 1.93 | 37 | 40 | 20 | 19 | 0.68 | 0.83 | 1.51 |
| Dylan DeClerck - MIN | MIN | IND | 15 | 5 | 17 | 8 | 146 | 154 | 1 | 1 | 0 | 2 | 1 | 0 | 0 | 0 | 1 | 3 | 3 | 0.52 | 0.84 | 1.04 | 1.88 | 1 | 77 | 16 | 26 | 0.79 | 0.62 | 1.41 |
| Sam Cook - LA | LA | SLC | 15 | 20 | 1 | 55 | 177 | 232 | 0 | 2 | 1 | 0 | 0 | 0 | 0 | 0 | 0 | 3 | 2 | 0.66 | 1.87 | 0.00 | 1.87 | 24 | 5 | 27 | 11 | 1.07 | 0.00 | 1.07 |
| Quinn Snider - MIN | MIN | IND | 15 | 15 | 4 | 56 | 145 | 201 | 1 | 2 | 2 | 0 | 0 | 0 | 0 | 0 | 0 | 5 | 3 | 0.52 | 1.85 | 0.00 | 1.85 | 28 | 21 | 23 | 11 | 1.23 | 0.00 | 1.23 |
| Elijah Jaime - SLC | SLC | LA | 15 | 18 | 2 | 64 | 255 | 319 | 0 | 2 | 2 | 0 | 1 | 0 | 0 | 0 | 1 | 3 | 1 | 0.66 | 1.76 | 0.00 | 1.76 | 20 | 10 | 19 | 4 | 1.41 | 0.00 | 1.41 |
| Christian Boxley - DC | DC | NY | 15 | 21 | 5 | 97 | 85 | 182 | 0 | 3 | 2 | 0 | 0 | 0 | 0 | 0 | 0 | 5 | 3 | 0.78 | 1.73 | 0.00 | 1.73 | 53 | 19 | 23 | 14 | 1.15 | 0.00 | 1.15 |
| William Wettengel - IND | IND | MIN | 15 | 3 | 10 | -6 | 74 | 68 | 0 | 1 | 0 | 2 | 0 | 0 | 0 | 0 | 0 | 3 | 3 | 0.52 | 0.62 | 1.04 | 1.66 | 1 | 77 | 7 | 16 | 1.24 | 0.98 | 2.22 |
| Josh Klane - MIN | MIN | IND | 15 | 17 | 2 | 190 | 84 | 274 | 2 | 0 | 2 | 1 | 2 | 0 | 0 | 0 | 2 | 3 | 1 | 0.52 | 1.1 | 0.52 | 1.62 | 69 | 11 | 24 | 10 | 0.70 | 0.76 | 1.46 |
| Luke Yorgason - SLC | SLC | LA | 15 | 16 | 1 | 184 | 38 | 222 | 1 | 0 | 5 | 0 | 0 | 0 | 0 | 0 | 0 | 6 | 1 | 0.66 | 1.62 | 0 | 1.62 | 83 | 6 | 17 | 3 | 1.44 | 0.00 | 1.44 |
| Thomas Edmonds - DC | DC | NY | 15 | 8 | 9 | 65 | 125 | 190 | 1 | 1 | 2 | 0 | 0 | 0 | 0 | 0 | 0 | 4 | 2 | 0.78 | 1.59 | 0.00 | 1.59 | 34 | 53 | 7 | 13 | 3.18 | 0.00 | 3.18 |
| Tanner Barcus - MIN | MIN | IND | 15 | 1 | 13 | 19 | 7 | 26 | 0 | 2 | 0 | 2 | 0 | 0 | 0 | 0 | 0 | 4 | 4 | 0.52 | 0.54 | 1.04 | 1.58 | 73 | 93 | 9 | 20 | 0.86 | 0.79 | 1.66 |
| John Randolph - NY | NY | DC | 15 | 6 | 14 | 77 | 109 | 186 | 0 | 2 | 2 | 0 | 0 | 0 | 0 | 0 | 0 | 4 | 2 | 0.78 | 1.57 | 0.00 | 1.57 | 41 | 70 | 12 | 18 | 1.93 | 0.00 | 1.93 |
| Ben Katz - NY | NY | DC | 15 | 0 | 14 | 95 | -1 | 94 | 1 | 0 | 0 | 2 | 1 | 0 | 0 | 0 | 1 | 2 | 2 | 0.78 | 0.01 | 1.56 | 1.57 | 100 | 100 | 7 | 15 | 0.02 | 1.56 | 1.58 |
| Tony Mounga - SLC | SLC | LA | 15 | 1 | 14 | 69 | 14 | 83 | 1 | 1 | 0 | 1 | 0 | 0 | 0 | 0 | 0 | 3 | 3 | 0.66 | 0.9 | 0.66 | 1.57 | 83 | 93 | 5 | 17 | 2.40 | 0.59 | 2.99 |
| Christian Olsen - ATL | ATL | ATX | 15 | 20 | 2 | 122 | 132 | 254 | 1 | 2 | 2 | 0 | 1 | 0 | 0 | 0 | 1 | 4 | 2 | 0.63 | 1.56 | 0.00 | 1.56 | 48 | 9 | 23 | 6 | 1.04 | 0.00 | 1.0 |
| Marcel Osborne - LA | LA | SLC | 15 | 23 | 2 | 62 | 166 | 228 | 1 | 3 | 1 | 0 | 1 | 0 | 0 | 0 | 1 | 4 | 3 | 0.66 | 1.55 | 0.00 | 1.55 | 27 | 8 | 33 | 13 | 0.73 | 0.00 | 0.73 |
| Levi Jacobs - IND | IND | MIN | 15 | 18 | 2 | 27 | 175 | 202 | 1 | 0 | 1 | 0 | 0 | 0 | 0 | 0 | 0 | 2 | 1 | 0.52 | 1.49 | 0.00 | 1.49 | 13 | 10 | 27 | 12 | 0.85 | 0.00 | 0.85 |
| Marques Brownlee - NY | NY | DC | 15 | 1 | 18 | 16 | 54 | 70 | 1 | 0 | 0 | 1 | 0 | 0 | 0 | 0 | 0 | 2 | 2 | 0.78 | 0.64 | 0.78 | 1.42 | 23 | 95 | 9 | 20 | 1.02 | 0.59 | 1.62 |
| Paul Krenik - MIN | MIN | IND | 15 | 6 | 16 | 5 | 36 | 41 | 0 | 3 | 0 | 1 | 0 | 0 | 0 | 0 | 0 | 4 | 4 | 0.52 | 0.82 | 0.52 | 1.34 | 12 | 73 | 14 | 23 | 0.87 | 0.35 | 1.22 |
| Xavier Payne - IND | IND | MIN | 15 | 17 | 7 | 319 | 122 | 441 | 3 | 0 | 2 | 0 | 4 | 0 | 1 | 1 | 4 | 1 | -2 | 0.52 | 1.32 | 0.00 | 1.32 | 72 | 29 | 27 | 18 | 0.75 | 0.00 | 0.75 |
| Nick Hutton - IND | IND | MIN | 15 | 2 | 12 | 93 | -33 | 60 | 2 | 0 | 0 | 1 | 0 | 0 | 0 | 0 | 0 | 3 | 3 | 0.52 | 0.76 | 0.52 | 1.28 | 100 | 86 | 6 | 17 | 1.74 | 0.46 | 2.20 |
| Bradley Seuntjens - ATL | ATL | ATX | 15 | 4 | 12 | 0 | 0 | 0 | 0 | 0 | 0 | 2 | 0 | 0 | 0 | 0 | 0 | 2 | 2 | 0.63 | 0 | 1.26 | 1.26 | 50 | 75 | 6 | 20 | 0.00 | 0.96 | 0.96 |
| Jacob Fella - IND | IND | MIN | 15 | 2 | 13 | -11 | 96 | 85 | 0 | 1 | 1 | 2 | 0 | 0 | 1 | 0 | 1 | 3 | 2 | 0.52 | 0.21 | 1.04 | 1.25 | 1 | 87 | 6 | 18 | 0.48 | 0.88 | 1.36 |
| Matthew Armour - ATX | ATX | ATL | 15 | 7 | 17 | 46 | 39 | 85 | 2 | 1 | 0 | 0 | 0 | 0 | 0 | 0 | 0 | 3 | 3 | 0.63 | 1.1 | 0.00 | 1.10 | 54 | 71 | 12 | 24 | 1.35 | 0.00 | 1.35 |
| Jordan Taylor - MIN | MIN | IND | 15 | 13 | 2 | 99 | 66 | 165 | 1 | 2 | 1 | 0 | 1 | 0 | 0 | 0 | 1 | 3 | 2 | 0.52 | 1.1 | 0.00 | 1.10 | 60 | 13 | 19 | 10 | 0.88 | 0.00 | 0.88 |
| Brandon Matis - MIN | MIN | IND | 15 | 1 | 11 | 29 | 82 | 111 | 1 | 1 | 0 | 1 | 1 | 0 | 0 | 0 | 1 | 2 | 2 | 0.52 | 0.57 | 0.52 | 1.09 | 26 | 92 | 8 | 17 | 1.01 | 0.46 | 1.48 |
| Jonny Hoffman - SLC | SLC | LA | 15 | 1 | 17 | 1 | 33 | 34 | 0 | 1 | 0 | 1 | 0 | 0 | 0 | 0 | 0 | 2 | 2 | 0.66 | 0.4 | 0.66 | 1.07 | 1 | 94 | 8 | 23 | 0.71 | 0.44 | 1.15 |
| Seth Gudeman - IND | IND | MIN | 15 | 4 | 10 | 34 | 20 | 54 | 1 | 0 | 0 | 1 | 0 | 0 | 0 | 0 | 0 | 2 | 2 | 0.52 | 0.53 | 0.52 | 1.05 | 63 | 71 | 10 | 19 | 0.77 | 0.42 | 1.19 |
| Keegan North - IND | IND | MIN | 15 | 14 | 11 | 135 | 132 | 267 | 0 | 2 | 3 | 0 | 2 | 0 | 0 | 0 | 2 | 3 | 0 | 0.52 | 1.05 | 0.00 | 1.05 | 51 | 44 | 23 | 23 | 0.70 | 0.00 | 0.70 |
| Calvin Brown - LA | LA | SLC | 15 | 6 | 17 | 52 | 50 | 102 | 2 | 0 | 0 | 1 | 1 | 0 | 0 | 0 | 1 | 2 | 2 | 0.66 | 0.37 | 0.66 | 1.03 | 51 | 74 | 8 | 22 | 0.66 | 0.46 | 1.12 |
| Mike Kobyra - ATL | ATL | ATX | 15 | 2 | 12 | -1 | 31 | 30 | 0 | 1 | 1 | 1 | 0 | 0 | 0 | 0 | 0 | 3 | 2 | 0.63 | 0.38 | 0.63 | 1.01 | 1 | 86 | 4 | 16 | 1.22 | 0.59 | 1.81 |
| David Bloodgood - DC | DC | NY | 15 | 2 | 14 | 0 | 0 | 0 | 0 | 1 | 0 | 1 | 0 | 0 | 0 | 0 | 0 | 2 | 2 | 0.78 | 0.18 | 0.78 | 0.97 | 50 | 88 | 0 | 16 | 2.88 | 0.73 | 3.61 |
| Zach Slayton - ATX | ATX | ATL | 15 | 19 | 4 | 24 | 136 | 160 | 0 | 3 | 2 | 0 | 0 | 1 | 0 | 0 | 1 | 4 | 2 | 0.63 | 0.96 | 0.00 | 0.96 | 15 | 17 | 28 | 11 | 0.53 | 0.00 | 0.53 |
| Bryan Vohnoutka - MIN | MIN | IND | 15 | 11 | 10 | 47 | 94 | 141 | 2 | 1 | 3 | 0 | 1 | 0 | 0 | 0 | 1 | 5 | 2 | 0.52 | 0.94 | 0.00 | 0.94 | 33 | 48 | 20 | 19 | 0.72 | 0.00 | 0.72 |
| Rowan McDonnell - DC | DC | NY | 15 | 17 | 5 | 106 | 126 | 232 | 0 | 1 | 2 | 0 | 2 | 0 | 0 | 1 | 1 | 2 | -1 | 0.78 | 0.9 | 0.00 | 0.90 | 46 | 23 | 17 | 12 | 0.80 | 0.00 | 0.80 |
| Sam Berglund - MIN | MIN | IND | 15 | 5 | 13 | 275 | 17 | 292 | 3 | 0 | 2 | 0 | 3 | 0 | 0 | 0 | 3 | 2 | 0 | 0.52 | 0.88 | 0.00 | 0.88 | 94 | 72 | 14 | 22 | 0.94 | 0.00 | 0.94 |
| Conner Henderson - IND | IND | MIN | 15 | 4 | 10 | 9 | 17 | 26 | 0 | 1 | 0 | 1 | 0 | 0 | 0 | 0 | 0 | 2 | 2 | 0.52 | 0.35 | 0.52 | 0.87 | 35 | 71 | 10 | 19 | 0.51 | 0.42 | 0.93 |
| Bret Bergmeier - MIN | MIN | IND | 15 | 5 | 13 | 60 | 66 | 126 | 2 | 1 | 2 | 0 | 1 | 0 | 0 | 0 | 1 | 4 | 2 | 0.52 | 0.85 | 0.00 | 0.85 | 48 | 72 | 14 | 21 | 0.91 | 0.00 | 0.91 |
| Abe Coffin - MIN | MIN | IND | 15 | 16 | 3 | 136 | 128 | 264 | 0 | 1 | 1 | 0 | 2 | 0 | 0 | 0 | 2 | 0 | -1 | 0.52 | 0.85 | 0.00 | 0.85 | 52 | 16 | 22 | 10 | 0.59 | 0.00 | 0.59 |
| Troy Holland - DC | DC | NY | 15 | 3 | 16 | 9 | 0 | 9 | 0 | 0 | 0 | 1 | 0 | 0 | 0 | 0 | 0 | 1 | 1 | 0.78 | 0.06 | 0.78 | 0.84 | 100 | 84 | 1 | 20 | 0.48 | 0.59 | 1.07 |
| Oliver Fay - ATX | ATX | ATL | 15 | 4 | 14 | 8 | 23 | 31 | 0 | 0 | 0 | 1 | 0 | 0 | 0 | 0 | 0 | 1 | 1 | 0.63 | 0.2 | 0.63 | 0.83 | 26 | 78 | 6 | 20 | 0.46 | 0.48 | 0.94 |
| Kyle Weinberg - SLC | SLC | LA | 15 | 2 | 19 | 19 | 6 | 25 | 0 | 0 | 0 | 1 | 0 | 0 | 0 | 0 | 0 | 1 | 1 | 0.66 | 0.16 | 0.66 | 0.82 | 76 | 90 | 8 | 28 | 0.28 | 0.36 | 0.65 |
| Cole Jurek - DC | DC | NY | 15 | 23 | 1 | 51 | 164 | 215 | 1 | 0 | 1 | 0 | 0 | 0 | 1 | 0 | 1 | 1 | 0 | 0.78 | 0.79 | 0.00 | 0.79 | 24 | 4 | 25 | 9 | 0.49 | 0.00 | 0.49 |
| AJ Merriman - DC | DC | NY | 15 | 3 | 12 | 0 | 0 | 0 | 0 | 0 | 0 | 1 | 0 | 0 | 0 | 0 | 0 | 1 | 1 | 0.78 | 0 | 0.78 | 0.78 | 50 | 80 | 2 | 16 | 0.00 | 0.73 | 0.73 |
| Ben Hoffman - SLC | SLC | LA | 15 | 0 | 8 | 0 | 60 | 60 | 0 | 2 | 0 | 0 | 0 | 0 | 0 | 0 | 0 | 2 | 2 | 0.66 | 0.76 | 0.00 | 0.76 | 1 | 100 | 3 | 8 | 3.04 | 0.00 | 3.04 |
| Mick Walter - ATX | ATX | ATL | 15 | 2 | 10 | 33 | 54 | 87 | 0 | 1 | 1 | 1 | 1 | 0 | 0 | 0 | 1 | 2 | 1 | 0.63 | 0.12 | 0.63 | 0.75 | 38 | 83 | 6 | 13 | 0.27 | 0.72 | 0.99 |
| Antoine Davis - NY | NY | DC | 15 | 1 | 18 | 31 | 55 | 86 | 0 | 1 | 0 | 0 | 0 | 0 | 0 | 0 | 0 | 1 | 1 | 0.78 | 0.74 | 0.00 | 0.74 | 36 | 95 | 8 | 20 | 1.32 | 0.00 | 1.32 |
| Billy O'Bryan - ATL | ATL | ATX | 15 | 3 | 16 | 70 | 15 | 85 | 0 | 1 | 1 | 0 | 0 | 0 | 0 | 0 | 0 | 2 | 1 | 0.63 | 0.73 | 0.00 | 0.73 | 82 | 84 | 9 | 23 | 1.17 | 0.00 | 1.17 |
| Jeremy Langdon - ATL | ATL | ATX | 15 | 5 | 12 | 20 | 63 | 83 | 0 | 1 | 1 | 1 | 1 | 0 | 1 | 1 | 1 | 2 | 0 | 0.63 | 0.09 | 0.63 | 0.72 | 24 | 71 | 10 | 18 | 0.13 | 0.53 | 0.66 |
| Jackson Potts - ATX | ATX | ATL | 15 | 3 | 14 | -21 | 34 | 13 | 0 | 0 | 0 | 1 | 0 | 0 | 0 | 0 | 0 | 1 | 1 | 0.63 | 0.08 | 0.63 | 0.71 | 1 | 82 | 5 | 19 | 0.21 | 0.50 | 0.72 |
| Dean Ramsey - ATL | ATL | ATX | 15 | 7 | 11 | -1 | 12 | 11 | 0 | 0 | 0 | 1 | 0 | 0 | 0 | 0 | 0 | 1 | 1 | 0.63 | 0.07 | 0.63 | 0.70 | 1 | 61 | 13 | 22 | 0.08 | 0.44 | 0.52 |
| Kevin Healey - DC | DC | NY | 15 | 13 | 3 | 15 | 125 | 140 | 0 | 3 | 0 | 0 | 1 | 0 | 0 | 0 | 1 | 2 | 2 | 0.78 | 0.68 | 0.00 | 0.68 | 11 | 19 | 12 | 7 | 0.84 | 0.00 | 0.84 |
| Karl Ekwurtzel - ATL | ATL | ATX | 15 | 10 | 1 | 46 | 57 | 103 | 0 | 0 | 0 | 0 | 0 | 0 | 0 | 0 | 0 | 0 | 0 | 0.63 | 0.66 | 0.00 | 0.66 | 45 | 9 | 11 | 5 | 0.88 | 0.00 | 0.88 |
| Jason Vallee - LA | LA | SLC | 15 | 0 | 12 | 0 | 0 | 0 | 0 | 0 | 0 | 1 | 0 | 0 | 0 | 0 | 0 | 1 | 1 | 0.66 | 0 | 0.66 | 0.66 | 50 | 100 | 2 | 13 | 0.00 | 0.75 | 0.75 |
| Devon Terry - SLC | SLC | LA | 15 | 2 | 17 | 0 | 0 | 0 | 0 | 0 | 0 | 1 | 0 | 0 | 0 | 0 | 0 | 1 | 1 | 0.66 | 0 | 0.66 | 0.66 | 50 | 89 | 5 | 23 | 0.00 | 0.44 | 0.44 |
| Mark Henke - ATX | ATX | ATL | 15 | 1 | 14 | 0 | 0 | 0 | 0 | 0 | 0 | 1 | 0 | 0 | 0 | 0 | 0 | 1 | 1 | 0.63 | 0 | 0.63 | 0.63 | 50 | 93 | 6 | 17 | 0.00 | 0.56 | 0.56 |
| Carter Rae - IND | IND | MIN | 15 | 4 | 10 | 64 | 82 | 146 | 1 | 0 | 0 | 0 | 1 | 0 | 0 | 0 | 1 | 0 | 0 | 0.52 | 0.61 | 0.00 | 0.61 | 44 | 71 | 10 | 19 | 0.89 | 0.00 | 0.89 |
| Justin Burnett - ATL | ATL | ATX | 15 | 3 | 17 | 11 | 71 | 82 | 0 | 0 | 0 | 1 | 0 | 1 | 0 | 0 | 1 | 0 | 0 | 0.63 | -0.1 | 0.63 | 0.53 | 13 | 85 | 8 | 25 | -0.18 | 0.39 | 0.21 |
| Bretton Tan - NY | NY | DC | 15 | 1 | 14 | 21 | 30 | 51 | 1 | 0 | 0 | 0 | 0 | 0 | 0 | 0 | 0 | 1 | 1 | 0.78 | 0.51 | 0.00 | 0.51 | 41 | 93 | 8 | 16 | 0.91 | 0.00 | 0.91 |
| Hayden Austin-Knab - ATL | ATL | ATX | 15 | 2 | 13 | 40 | 36 | 76 | 0 | 0 | 0 | 1 | 1 | 0 | 0 | 0 | 1 | 0 | 0 | 0.63 | -0.14 | 0.63 | 0.49 | 53 | 87 | 9 | 19 | -0.22 | 0.50 | 0.28 |
| Noah Chambers - ATX | ATX | ATL | 15 | 15 | 2 | 2 | 110 | 112 | 1 | 1 | 1 | 0 | 1 | 0 | 0 | 0 | 1 | 2 | 1 | 0.63 | 0.46 | 0.00 | 0.46 | 1 | 12 | 19 | 8 | 0.37 | 0.00 | 0.37 |
| Chris Mazur - LA | LA | SLC | 15 | 4 | 5 | 18 | -9 | 9 | 1 | 1 | 0 | 0 | 0 | 0 | 0 | 0 | 0 | 2 | 2 | 0.66 | 0.43 | 0.00 | 0.43 | 100 | 56 | 7 | 8 | 0.86 | 0.00 | 0.86 |
| Mike Drost - NY | NY | DC | 15 | 0 | 14 | 0 | 33 | 33 | 0 | 1 | 0 | 0 | 0 | 0 | 0 | 0 | 0 | 1 | 1 | 0.78 | 0.4 | 0.00 | 0.40 | 1 | 100 | 2 | 14 | 2.13 | 0.00 | 2.13 |
| Elliott Moore - ATX | ATX | ATL | 15 | 1 | 11 | 41 | 19 | 60 | 0 | 0 | 0 | 0 | 0 | 0 | 0 | 0 | 0 | 0 | 0 | 0.63 | 0.39 | 0.00 | 0.39 | 68 | 92 | 5 | 13 | 1.04 | 0.00 | 1.04 |
| Noah Hanson - MIN | MIN | IND | 15 | 1 | 11 | 3 | -5 | -2 | 1 | 1 | 0 | 1 | 1 | 0 | 0 | 0 | 1 | 2 | 2 | 0.52 | -0.16 | 0.52 | 0.36 | 1 | 92 | 9 | 17 | -0.26 | 0.46 | 0.21 |
| Michael Jordan - MIN | MIN | IND | 15 | 10 | 0 | 26 | 109 | 135 | 0 | 0 | 0 | 0 | 1 | 0 | 0 | 0 | 1 | -1 | -1 | 0.52 | 0.35 | 0.00 | 0.35 | 19 | 0 | 16 | 8 | 0.33 | 0.00 | 0.33 |
| Brandon Dial - ATX | ATX | ATL | 15 | 3 | 16 | 2 | 21 | 23 | 1 | 0 | 0 | 0 | 0 | 0 | 0 | 0 | 0 | 1 | 1 | 0.63 | 0.33 | 0.00 | 0.33 | 1 | 84 | 8 | 22 | 0.59 | 0.00 | 0.59 |
| Eric Carter - ATX | ATX | ATL | 15 | 2 | 7 | 12 | 34 | 46 | 0 | 0 | 1 | 0 | 0 | 0 | 0 | 0 | 0 | 1 | 0 | 0.63 | 0.3 | 0.00 | 0.30 | 26 | 78 | 2 | 9 | 1.60 | 0.00 | 1.60 |
| Mischa Freystaetter - ATL | ATL | ATX | 15 | 2 | 12 | 22 | 17 | 39 | 0 | 0 | 0 | 1 | 0 | 0 | 1 | 0 | 1 | 0 | 0 | 0.63 | -0.38 | 0.63 | 0.25 | 56 | 86 | 8 | 19 | -0.68 | 0.50 | -0.17 |
| Max Dehlin - SLC | SLC | LA | 15 | 0 | 7 | 0 | 10 | 10 | 1 | 0 | 0 | 1 | 1 | 0 | 0 | 0 | 1 | 1 | 1 | 0.66 | -0.41 | 0.66 | 0.25 | 1 | 100 | 6 | 10 | -0.94 | 0.96 | 0.02 |
| Ethan Fortin - NY | NY | DC | 15 | 0 | 12 | 16 | 15 | 31 | 0 | 0 | 0 | 0 | 0 | 0 | 0 | 0 | 0 | 0 | 0 | 0.78 | 0.2 | 0.00 | 0.20 | 52 | 100 | 7 | 13 | 0.40 | 0.00 | 0.40 |
| Will Quigley - IND | IND | MIN | 15 | 0 | 10 | 8 | 13 | 21 | 0 | 0 | 0 | 0 | 0 | 0 | 0 | 0 | 0 | 0 | 0 | 0.52 | 0.14 | 0.00 | 0.14 | 38 | 100 | 4 | 12 | 0.45 | 0.00 | 0.45 |
| Jeremy Keusch - IND | IND | MIN | 15 | 20 | 2 | 46 | 129 | 175 | 0 | 3 | 2 | 0 | 1 | 0 | 2 | 0 | 3 | 2 | 0 | 0.52 | 0.12 | 0.00 | 0.12 | 26 | 9 | 30 | 15 | 0.06 | 0.00 | 0.06 |
| Shashank Alladi - NY | NY | DC | 15 | 0 | 12 | 12 | 5 | 17 | 0 | 0 | 0 | 0 | 0 | 0 | 0 | 0 | 0 | 0 | 0 | 0.78 | 0.11 | 0.00 | 0.11 | 71 | 100 | 1 | 12 | 0.88 | 0.00 | 0.88 |
| Lukas Ambrose - LA | LA | SLC | 15 | 6 | 22 | 0 | 15 | 15 | 0 | 0 | 0 | 0 | 0 | 0 | 0 | 0 | 0 | 0 | 0 | 0.66 | 0.1 | 0.00 | 0.10 | 1 | 79 | 8 | 27 | 0.18 | 0.00 | 0.18 |
| Michael Matthis - ATX | ATX | ATL | 15 | 0 | 13 | 1 | 9 | 10 | 0 | 0 | 0 | 0 | 0 | 0 | 0 | 0 | 0 | 0 | 0 | 0.63 | 0.06 | 0.00 | 0.06 | 10 | 100 | 5 | 13 | 0.16 | 0.00 | 0.16 |
| Moussa Dia - DC | DC | NY | 15 | 2 | 12 | 0 | 9 | 9 | 0 | 0 | 0 | 0 | 0 | 0 | 0 | 0 | 0 | 0 | 0 | 0.78 | 0.06 | 0.00 | 0.06 | 1 | 86 | 2 | 15 | 0.32 | 0.00 | 0.32 |
| Jeff Holm - NY | NY | DC | 15 | 0 | 12 | 5 | 0 | 5 | 0 | 0 | 0 | 0 | 0 | 0 | 0 | 0 | 0 | 0 | 0 | 0.78 | 0.03 | 0.00 | 0.03 | 100 | 100 | 1 | 12 | 0.24 | 0.00 | 0.24 |
| Jeremiah Branson - IND | IND | MIN | 15 | 4 | 9 | 64 | 19 | 83 | 0 | 0 | 0 | 1 | 2 | 0 | 0 | 0 | 2 | -1 | -1 | 0.52 | -0.5 | 0.52 | 0.02 | 77 | 69 | 10 | 18 | -0.73 | 0.44 | -0.29 |
| Garrett Santi - LA | LA | SLC | 15 | 2 | 17 | 0 | 2 | 2 | 0 | 0 | 0 | 0 | 0 | 0 | 0 | 0 | 0 | 0 | 0 | 0.66 | 0.01 | 0.00 | 0.01 | 1 | 89 | 2 | 19 | 0.05 | 0.00 | 0.05 |
| Ian McCosky - MIN | MIN | IND | 15 | 0 | 12 | 2 | 0 | 2 | 0 | 0 | 1 | 0 | 0 | 0 | 0 | 0 | 0 | 1 | 0 | 0.52 | 0.01 | 0.00 | 0.01 | 100 | 100 | 7 | 17 | 0.02 | 0.00 | 0.02 |
| Tristan Van de Moortele - MIN | MIN | IND | 15 | 5 | 17 | 2 | 0 | 2 | 0 | 0 | 0 | 0 | 0 | 0 | 0 | 0 | 0 | 0 | 0 | 0.52 | 0.01 | 0.00 | 0.01 | 100 | 77 | 13 | 25 | 0.01 | 0.00 | 0.01 |
| Bradley Fleming - ATL | ATL | ATX | 15 | 1 | 9 | 0 | 0 | 0 | 0 | 0 | 0 | 0 | 0 | 0 | 0 | 0 | 0 | 0 | 0 | 0.63 | 0 | 0.00 | 0.00 | 50 | 90 | 3 | 12 | 0.00 | 0.00 | 0.00 |
| Jakeem Polk - ATL | ATL | ATX | 15 | 2 | 8 | 0 | 0 | 0 | 0 | 0 | 0 | 0 | 0 | 0 | 0 | 0 | 0 | 0 | 0 | 0.63 | 0 | 0.00 | 0.00 | 50 | 80 | 3 | 12 | 0.00 | 0.00 | 0.00 |
| Trenton Spinks - ATL | ATL | ATX | 15 | 3 | 9 | 0 | 0 | 0 | 0 | 0 | 0 | 0 | 0 | 0 | 0 | 0 | 0 | 0 | 0 | 0.63 | 0 | 0.00 | 0.00 | 50 | 75 | 4 | 15 | 0.00 | 0.00 | 0.00 |
| Joshua Zdrodowski - ATX | ATX | ATL | 15 | 2 | 7 | 0 | 0 | 0 | 0 | 0 | 0 | 0 | 0 | 0 | 0 | 0 | 0 | 0 | 0 | 0.63 | 0 | 0.00 | 0.00 | 50 | 78 | 2 | 9 | 0.00 | 0.00 | 0.00 |
| Alexandre Fall - DC | DC | NY | 15 | 3 | 13 | 0 | 0 | 0 | 0 | 0 | 0 | 0 | 0 | 0 | 0 | 0 | 0 | 0 | 0 | 0.78 | 0 | 0.00 | 0.00 | 50 | 81 | 0 | 16 | 0.00 | 0.00 | 0.00 |
| David Cranston - DC | DC | NY | 15 | 3 | 15 | 0 | 0 | 0 | 0 | 0 | 0 | 0 | 0 | 0 | 0 | 0 | 0 | 0 | 0 | 0.78 | 0 | 0.00 | 0.00 | 50 | 83 | 0 | 18 | 0.00 | 0.00 | 0.00 |
| Rhys Bergeron - DC | DC | NY | 15 | 2 | 11 | 0 | 0 | 0 | 0 | 0 | 0 | 0 | 0 | 0 | 0 | 0 | 0 | 0 | 0 | 0.78 | 0 | 0.00 | 0.00 | 50 | 85 | 0 | 13 | 0.00 | 0.00 | 0.00 |
| Charlie McCutcheon - DC | DC | NY | 15 | 3 | 9 | 0 | 0 | 0 | 0 | 0 | 0 | 0 | 0 | 0 | 0 | 0 | 0 | 0 | 0 | 0.78 | 0 | 0.00 | 0.00 | 50 | 75 | 1 | 13 | 0.00 | 0.00 | 0.00 |
| Jasper Tom - DC | DC | NY | 15 | 2 | 11 | 0 | 0 | 0 | 0 | 0 | 0 | 0 | 0 | 0 | 0 | 0 | 0 | 0 | 0 | 0.78 | 0 | 0.00 | 0.00 | 50 | 85 | 1 | 14 | 0.00 | 0.00 | 0.00 |
| Joe Merrill - DC | DC | NY | 15 | 0 | 8 | 0 | 0 | 0 | 0 | 0 | 0 | 0 | 0 | 0 | 0 | 0 | 0 | 0 | 0 | 0.78 | 0 | 0.00 | 0.00 | 50 | 100 | 1 | 9 | 0.00 | 0.00 | 0.00 |
| Jason Kempe - IND | IND | MIN | 15 | 0 | 9 | 0 | 0 | 0 | 0 | 0 | 0 | 0 | 0 | 0 | 0 | 0 | 0 | 0 | 0 | 0.52 | 0 | 0.00 | 0.00 | 50 | 100 | 4 | 11 | 0.00 | 0.00 | 0.00 |
| Andrew Padula - LA | LA | SLC | 15 | 1 | 12 | 0 | 0 | 0 | 0 | 0 | 0 | 0 | 0 | 0 | 0 | 0 | 0 | 0 | 0 | 0.66 | 0 | 0.00 | 0.00 | 50 | 92 | 1 | 13 | 0.00 | 0.00 | 0.00 |
| Kevin Tien - LA | LA | SLC | 15 | 1 | 11 | 0 | 0 | 0 | 0 | 0 | 0 | 0 | 0 | 0 | 0 | 0 | 0 | 0 | 0 | 0.66 | 0 | 0.00 | 0.00 | 50 | 92 | 3 | 13 | 0.00 | 0.00 | 0.00 |
| Landon Shank - LA | LA | SLC | 15 | 2 | 5 | 0 | 0 | 0 | 0 | 0 | 0 | 0 | 0 | 0 | 0 | 0 | 0 | 0 | 0 | 0.66 | 0 | 0.00 | 0.00 | 50 | 71 | 4 | 8 | 0.00 | 0.00 | 0.00 |
| Milan Ravenell - LA | LA | SLC | 15 | 1 | 8 | 0 | 0 | 0 | 0 | 0 | 0 | 0 | 0 | 0 | 0 | 0 | 0 | 0 | 0 | 0.66 | 0 | 0.00 | 0 | 50 | 89 | 1 | 9 | 0.00 | 0.00 | 0.00 |
| Mitchell Steiner - LA | LA | SLC | 15 | 4 | 18 | 0 | 0 | 0 | 0 | 0 | 0 | 0 | 0 | 0 | 0 | 0 | 0 | 0 | 0 | 0.66 | 0 | 0.00 | 0.00 | 50 | 82 | 5 | 23 | 0.00 | 0.00 | 0.00 |
| Zac Schakner - LA | LA | SLC | 15 | 0 | 5 | 0 | 0 | 0 | 0 | 0 | 0 | 0 | 0 | 0 | 0 | 0 | 0 | 0 | 0 | 0.66 | 0 | 0.00 | 0.00 | 50 | 100 | 1 | 5 | 0.00 | 0.00 | 0.00 |
| James Kittlesen - MIN | MIN | IND | 15 | 0 | 13 | 0 | 0 | 0 | 0 | 0 | 0 | 0 | 0 | 0 | 0 | 0 | 0 | 0 | 0 | 0.52 | 0 | 0.00 | 0.00 | 50 | 100 | 7 | 18 | 0.00 | 0.00 | 0.00 |
| Josue Alorro - NY | NY | DC | 15 | 0 | 13 | 0 | 0 | 0 | 0 | 0 | 0 | 0 | 0 | 0 | 0 | 0 | 0 | 0 | 0 | 0.78 | 0 | 0.00 | 0.00 | 50 | 100 | 1 | 13 | 0.00 | 0.00 | 0.00 |
| Matt Stevens - NY | NY | DC | 15 | 0 | 12 | 0 | 0 | 0 | 0 | 0 | 0 | 0 | 0 | 0 | 0 | 0 | 0 | 0 | 0 | 0.78 | 0 | 0.00 | 0.00 | 50 | 100 | 1 | 12 | 0.00 | 0.00 | 0.00 |
| Ryan Drost - NY | NY | DC | 15 | 1 | 13 | 0 | 0 | 0 | 0 | 0 | 0 | 0 | 0 | 0 | 0 | 0 | 0 | 0 | 0 | 0.78 | 0 | 0.00 | 0.00 | 50 | 93 | 8 | 15 | 0.00 | 0.00 | 0.00 |
| Ryan Holmes - NY | NY | DC | 15 | 0 | 13 | 0 | 0 | 0 | 0 | 0 | 0 | 0 | 0 | 0 | 0 | 0 | 0 | 0 | 0 | 0.78 | 0 | 0.00 | 0.00 | 50 | 100 | 1 | 13 | 0.00 | 0.00 | 0.00 |
| Ben Ashton - SLC | SLC | LA | 15 | 0 | 7 | 0 | 0 | 0 | 0 | 0 | 0 | 0 | 0 | 0 | 0 | 0 | 0 | 0 | 0 | 0.66 | 0 | 0.00 | 0.00 | 50 | 100 | 3 | 7 | 0.00 | 0.00 | 0.00 |
| Will Selfridge - SLC | SLC | LA | 15 | 1 | 17 | 0 | 0 | 0 | 0 | 0 | 0 | 0 | 0 | 0 | 0 | 0 | 0 | 0 | 0 | 0.66 | 0 | 0.00 | 0.00 | 50 | 94 | 8 | 23 | 0.00 | 0.00 | 0.00 |
| Reese Bowman - ATX | ATX | ATL | 15 | 2 | 10 | -10 | 7 | -3 | 0 | 0 | 0 | 0 | 0 | 0 | 0 | 0 | 0 | 0 | 0 | 0.63 | -0.02 | 0.00 | -0.02 | 100 | 83 | 3 | 12 | -0.08 | 0.00 | -0.08 |
| Matt Miller - LA | LA | SLC | 15 | 1 | 8 | -9 | 4 | -5 | 0 | 0 | 0 | 0 | 0 | 0 | 0 | 0 | 0 | 0 | 0 | 0.66 | -0.03 | 0.00 | -0.03 | 100 | 89 | 1 | 9 | -0.24 | 0.00 | -0.24 |
| Fletcher Hare - IND | IND | MIN | 15 | 5 | 10 | 3 | 43 | 46 | 0 | 1 | 0 | 0 | 1 | 0 | 0 | 0 | 1 | 0 | 0 | 0.52 | -0.04 | 0.00 | -0.04 | 1 | 67 | 11 | 20 | -0.05 | 0.00 | -0.05 |
| Ben Close - IND | IND | MIN | 15 | 2 | 11 | -26 | 18 | -8 | 0 | 0 | 0 | 0 | 0 | 0 | 0 | 0 | 0 | 0 | 0 | 0.52 | -0.05 | 0.00 | -0.05 | 100 | 85 | 6 | 16 | -0.11 | 0.00 | -0.11 |
| Joel Clutton - SLC | SLC | LA | 15 | 2 | 19 | 0 | -8 | -8 | 0 | 0 | 0 | 1 | 1 | 0 | 0 | 0 | 1 | 0 | 0 | 0.66 | -0.71 | 0.66 | -0.05 | 1 | 90 | 6 | 24 | -1.62 | 0.42 | -1.20 |
| Eric Brodbeck - ATX | ATX | ATL | 15 | 4 | 8 | -20 | 9 | -11 | 0 | 0 | 0 | 0 | 0 | 0 | 0 | 0 | 0 | 0 | 0 | 0.63 | -0.07 | 0.00 | -0.07 | 100 | 67 | 5 | 10 | -0.19 | 0.00 | -0.19 |
| JP Burns - ATL | ATL | ATX | 15 | 3 | 17 | 17 | 32 | 49 | 1 | 0 | 0 | 0 | 1 | 0 | 0 | 0 | 1 | 0 | 0 | 0.63 | -0.13 | 0.00 | -0.13 | 35 | 85 | 10 | 27 | -0.19 | 0.00 | -0.19 |
| Jake Radack - ATX | ATX | ATL | 15 | 22 | 4 | 302 | 80 | 382 | 3 | 0 | 4 | 0 | 4 | 0 | 1 | 0 | 5 | 2 | -2 | 0.63 | -0.14 | 0.00 | -0.14 | 79 | 15 | 31 | 12 | -0.07 | 0.00 | -0.07 |
| Ben Landry - IND | IND | MIN | 15 | 4 | 9 | 40 | 9 | 49 | 0 | 0 | 1 | 0 | 0 | 0 | 1 | 0 | 1 | 0 | -1 | 0.52 | -0.2 | 0.00 | -0.20 | 82 | 69 | 10 | 18 | -0.29 | 0.00 | -0.29 |
| Chad Yorgason - SLC | SLC | LA | 15 | 2 | 19 | 25 | 7 | 32 | 1 | 0 | 0 | 0 | 1 | 0 | 0 | 0 | 1 | 0 | 0 | 0.66 | -0.27 | 0.00 | -0.27 | 78 | 90 | 9 | 28 | -0.43 | 0.00 | -0.43 |
| Daniel Brunker - LA | LA | SLC | 15 | 4 | 12 | 57 | 51 | 108 | 1 | 0 | 1 | 0 | 2 | 0 | 0 | 0 | 2 | 0 | -1 | 0.66 | -0.44 | 0.00 | -0.44 | 53 | 75 | 5 | 14 | -1.17 | 0.00 | -1.17 |
| Cameron Lacy - MIN | MIN | IND | 15 | 0 | 11 | 0 | 13 | 13 | 0 | 0 | 0 | 0 | 1 | 0 | 0 | 0 | 1 | -1 | -1 | 0.52 | -0.44 | 0.00 | -0.44 | 1 | 100 | 7 | 16 | -0.88 | 0.00 | -0.88 |
| Eugene L'Heureux - SLC | SLC | LA | 15 | 1 | 9 | 6 | 11 | 17 | 0 | 0 | 0 | 0 | 1 | 0 | 0 | 0 | 1 | -1 | -1 | 0.66 | -0.55 | 0.00 | -0.55 | 35 | 90 | 2 | 12 | -2.93 | 0.00 | -2.93 |
| Nathan Huff - SLC | SLC | LA | 15 | 2 | 17 | 7 | 9 | 16 | 0 | 0 | 0 | 1 | 1 | 1 | 0 | 0 | 2 | -1 | -1 | 0.66 | -1.22 | 0.66 | -0.56 | 44 | 89 | 8 | 26 | -2.17 | 0.39 | -1.78 |
Legend
CP+: Completion percentage plus, a usage-weighted indicator of not committing turnovers
DPP: Defensive points played
E16: EDGE converted to per-point productivity and standardized to 16 POS and OppPOS. (EDGE-O*16)/(POS+1) + (EDGE-B*16)/(OppPOS+1)
E100: EO100+EB100
EB100: EDGE-B goal equivalents per 100 block opportunities (100*EDGE-B/BlkOpps)
EO100: EDGE-O goal equivalents per 100 possessions (100*EDGE-O/POS)
EDGE: EDGE-O + EDGE-B. Measured in Goal Equivalents
EDGE-B: Blocks*GameSE. Measured in Goal Equivalents
EDGE-O: TotYds* 0.007 (Approx) + (AST+GLS)* 0.18 (Approx) – TRN*GameSE. Measured in Goal Equivalents.
Actual coefficients depend on league averages.
E_TG: EDGE per team game, as opposed to EDGE per games played by the player
GmSE: Combined scoring efficiencies of both teams in a game. Used as indicator of turnover value in a game.
HA: Hockey assists.
MP: Minutes played
NET: Plus/Minus + HA. Adding HA to +/- corrects for strong anti-handler bias of +/- by itself, and is a much fairer assessment of net productivity. NET divided by two approximates EDGE totals.
OPP: Offensive points played
OppPos: Opponent possession (player on field while team is on defense). Sometimes OP.
POS: Possessions (player on field while team on offense)
QInc: Quarter-ending Incompletions, which are subtracted from AUDL turnover totals for BBSM calculations.
RYd: Receiving yards (net forward – backward yardage)
ThYd: Throwing yards (net forward – backward yardage)
TRN: Turnovers (Throwaways, Stalls, Drops, excluding QIncs)
Quarter-ending Incompletion, an incomplete last-throw of a quarter that the AUDL should distinguish from a turnover, for players and teams both. ↩
On July 21st of this year, Boston scored 18 goals and had just 2 turns (and 1 Qinc) against Montreal for a 90% SE. However, they did that just in the first half, and then the game was called by rain. ↩
Following last week’s Jasper Tom example, thank you DC Breeze D-line for consistently providing illustrative case studies. ↩
Better Box Score Metrics: Divisional Championships [AUDL Divisional Championships, 2023] is only available to Ultiworld Subscribers
Already have a subscription? Log in
Whether you visit Ultiworld for our reporting, our podcasts, or our video coverage, you can help us continue to provide high quality content with a subscription. By becoming a subscriber, not only do you receive benefits like exclusive articles and full article RSS feeds, you also help fund all of Ultiworld's coverage in general. We appreciate your support!