In God we trust. Everyone else, bring data.
January 19, 2021 by Pawel Janas in Opinion

Tuesday Tips are presented by Spin Ultimate; all opinions are those of the author. Please support the brands that make Ultiworld possible and shop at Spin Ultimate! This article was submitted as part of our Tuesday Tip Jar program.
Welcome to Part 2 of my column about heart function data and performance. This week’s piece is a deep dive into my WHOOP data over the last four years and, be warned, it gets weird. The picture that emerges lacks conventional beauty on one hand and is filled with unexpected nuance on the other1 — I’m not sure that I even totally understand it yet. Reader, if you are the type of person that prefers Twitter dunks and viral truth mongering, let me save you 15 minutes: exit out of here and smash that white and blue bird icon instead. If not, I hope you enjoy reading this piece as much as I enjoyed writing it.
In Part 1, I argued that monitoring your heart function is sort of a big deal, given the prominence of your heart in the whole “life” thing, yet it’s not as systematically measured as other fitness or strength indicators. With the advent of new technology in wearables, it’s only a matter of time before athletes — across sports and competitive levels — try to bio-hack their way into better cardiovascular shape. In this article, I will show you how I think about and analyze my WHOOP data.
Let’s get to it.
Caveats and Measurement
The first thing to keep in mind is that if the analysis below were to be taught2 at your local College of Arts and Science, it would be on the syllabus of a class academically on par with Underwater Basket Weaving 101 and not Organic Chemistry. There is no formal scientific discovery going on here3 and you should be inherently skeptical of my data and analysis. Nonetheless, I do believe observational data can be useful, especially when it documents changes over long periods of time like it does here. Just because basketry doesn’t add to the stock of human knowledge doesn’t make it meaningless, you know?
The second thing to keep in mind is that wearables and data, by themselves, don’t make you a better athlete. One more time for the people in the back: equipment is not going to make you faster, stronger, or more skilled at ultimate. A centrifuge isn’t responsible for Pfizer’s vaccine as much as the hard work of the scientists behind it.4 Data can tell you where you’ve been and where you might be heading next — nice info to have if you want to end up in a specific place5 — and it’s on you to turn empirical findings into real-world action.
Next, I turn to measurement. Like I mentioned in Part 1, Strain is a proprietary measure from 0 to 21 provided by WHOOP based on the amount of time spent at different levels of your maximum heart rate. All strain measures are my full-day strains. For reference, here’s a rough look at what the strain measures typically mean for me:
- 0 to 10: Woke up and sat. Ate and drank. Went back to bed.
- 10 to 13: 30-minute Game Point Performance warm-up followed by weight training
- 13 to 15: A pod workout with shuttles at the end
- 15 to 17: 90 minutes of 3-on-3 mini
- 17 to 19: 3-hour ultimate practice
- 19 to 21: AUDL game or day of Club tournament
Additionally, you will see resting heart rate (RHR) data, which is measured during the last couple of minutes of deep sleep and is expressed as heart beats per minute, as well as “optimal” strain targets given a specific recovery/heart rate variability (HRV) level,6 which was developed by WHOOP based on their own studies. The latter will be especially useful as I gauge the appropriateness of my own training strains. Sleep is measured in minutes and sleep performance is measured as the proportion of sleep obtained to WHOOP’s recommended sleep: higher strain or below baseline sleep in day t, more sleep is recommended for day t+1.
In today’s article, I will be showing you time series plots of various metrics such as HRV and strain. These are not actual daily readings: everything you see in this section is a seven-day rolling average (of the days before it), even after removing the most egregious outliers.7
With these caveats out of the way, let’s see how the last three years of competitive ultimate stack up.
Recovery and Cardiovascular Load Across Years: 2017 – 2019
Let me start with an ice-cold take: in order to maximize player and team development, individuals and teams should strive to be physically recovered not just before main competitions (the Series, the playoffs) but also throughout the whole season. A lack of recovery prevents improvement at practice and ultimately leads to fitness decline. Looking at my own data, it is clear that managing recovery is much easier said than done.
Different periods within a year
For me, no year-over-year comparison makes sense without first explicitly laying out the five distinct periods on my ultimate calendar. They are:
- Offseason (November – January): minimal competitive ultimate activity, 2-3x8 weight training, 2-3x low-impact conditioning
- Pre-season (February – April): 1x practice, 1x pod, 2x weight training, 1x conditioning
- In-season AUDL (May): 1x AUDL game, 1x practice, 1x pod, 2x weight training
- In-season AUDL + Club (June – July): 1x AUDL game, 2-3x practice, 1-2x weight training, 0.5-1x pod
- In-season Club (August – October): 2x practice, 2x ultimate games every third week, 1-2x pod, 1-2x weight training
In all years analyzed, I played on Chicago Union9 (AUDL) and Chicago Machine (Club).
2017: Roosters come home to roost
According to the Chinese calendar, 2017 was the year of the Rooster and I, my friends, am a Rooster. I’m not an expert in astrology but I’m pretty sure that your Zodiac year is supposed to be bad. Well, Astrology 1 : Pawel 0.
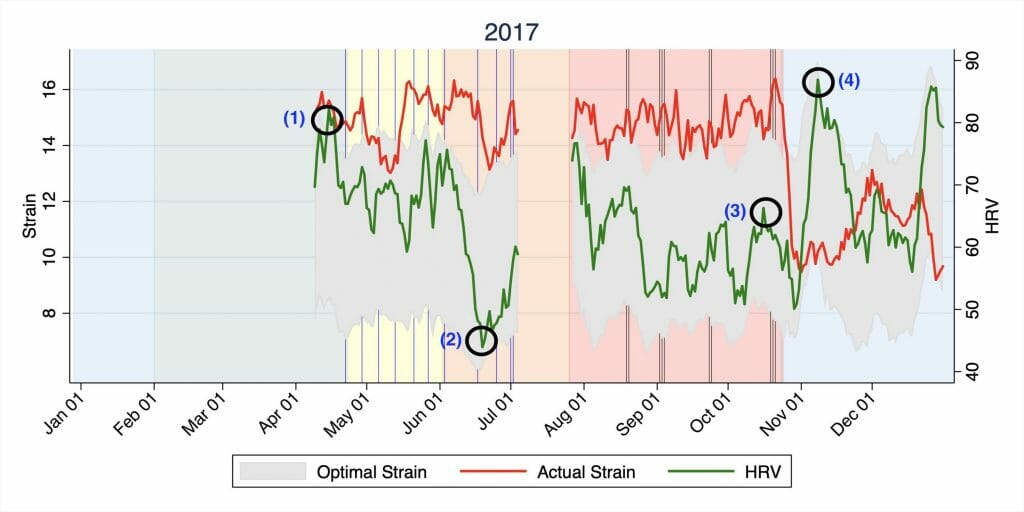
The figure above plots my recovery and strain for 2017. The red line denotes the strain (again, a seven-day average, left y-axis), the green line is HRV (right axis), and the gray area that moves more or less with the recovery is what WHOOP recommends as the band of optimal strain. The blue/green/yellow/orange/red shaded areas are the different time periods discussed above. Because my WHOOP was temporarily broken in July 2017, there is some missing data. The blue solid vertical lines between May and July represent AUDL games and the black lines are Club tournament days.
Three observations:
- I was not prepared to withstand the rigors of both AUDL and Club at the same time. This should be pretty clear to anyone with a single working eye, but let me direct your attention to the skyrocketing strain and nosediving HRV starting in the second half of the yellow period. My HRV fell from 80-ish in my most recovered state — April, circled point (1) — to a lowly 48-ish by the middle of June (2). This is a direct consequence of over-training, represented by the red line consistently hovering above the gray recommended area.
- Even though I kept overtraining during the entire year,10 I eventually recovered and was able to taper somewhat effectively for Club Nationals, as indicated by point (3). Good for me!
- I left a lot of recovery on the table. Comparing points (3) and (4) — which represent the end of the Club season and immediately after it, respectively — it is clear that my body was not in peak performance shape going into the most important competition in 2017.
2018: It actually got worse11)
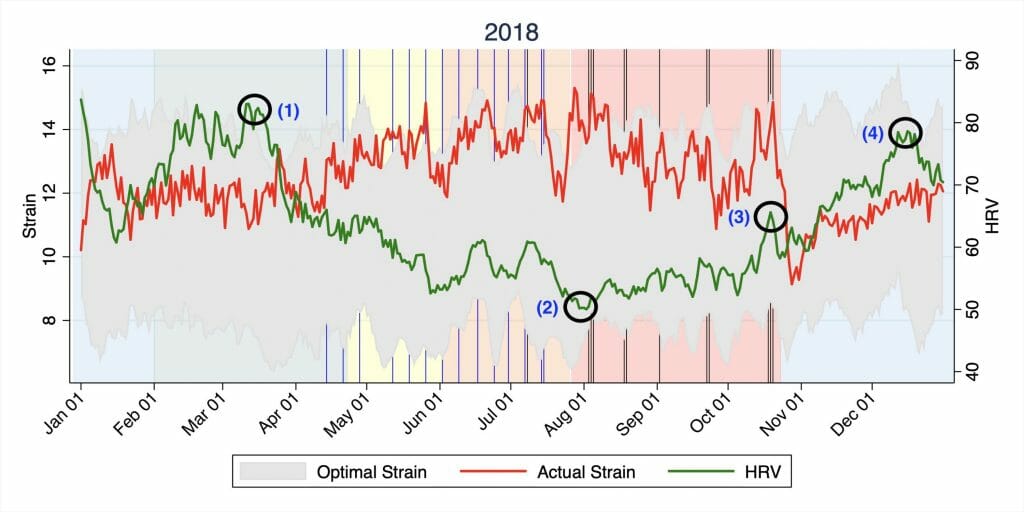
2018 was a steady decline into recovery purgatory. Again, like in 2017, my low point came at the end of the orange period (2). But, unlike 2017, I was unable to recover at all going into the Club-only period (shaded red). The peak pre-season recovery point (1) is the same as the previous year, the tapering period for Nationals (3) is also similar, but the stretch from August to November is, to use a scientific term, no bueno. This puzzles me a little because I was clearly overtraining less in 2018 than I was in 2017. In both cases, my within-season HRV was 20% or worse below my peak recovered state. The strains, though lower than in 2017, were still pushing and occasionally surpassing the boundary of WHOOP’s optimal training recommendations.
2019: Is this what long-term athletic development looks like?
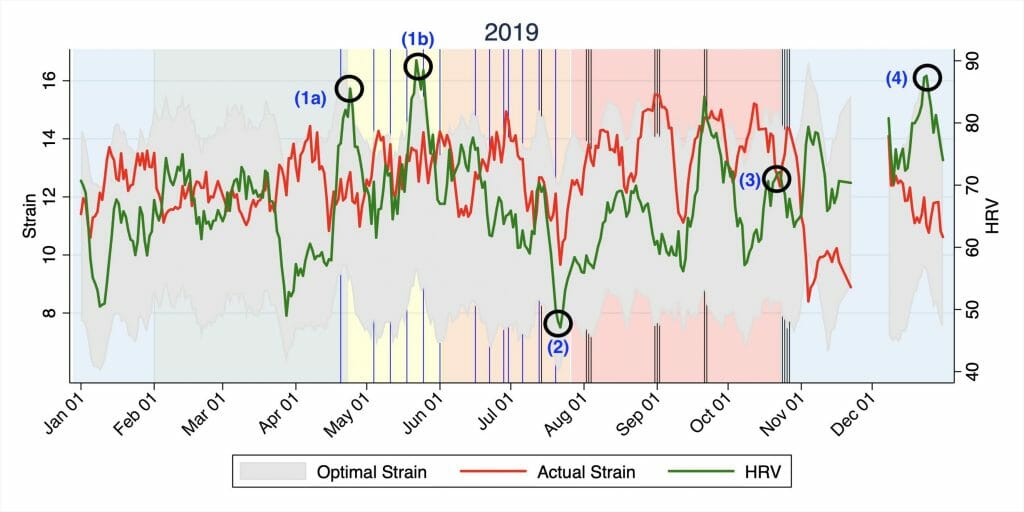
Ah yes, this looks much better. A few interesting things stand out in this figure. First, my recovery towards the end of the AUDL-only season (shaded yellow) matched my preseason (shaded green) highs, as denoted by the double peak of 1(a) and 1(b). Again, the same low point (2) occurs after the conclusion of the combined AUDL-Club season, but, unlike in2018, shot back up, and I was fully recovered for Regionals and Nationals — point (3) and the spike around September 25th. Specifically, HRV was 10% higher going into Nationals and I achieved new HRV highs by December.
Resting Heart Rates: When was I in shape?
Perhaps a cleaner and more direct way to measure my cardio fitness is to look directly at resting heart rate. In theory, a lower12 RHR indicates a stronger heart, better fitness, and more readiness to take on strain.
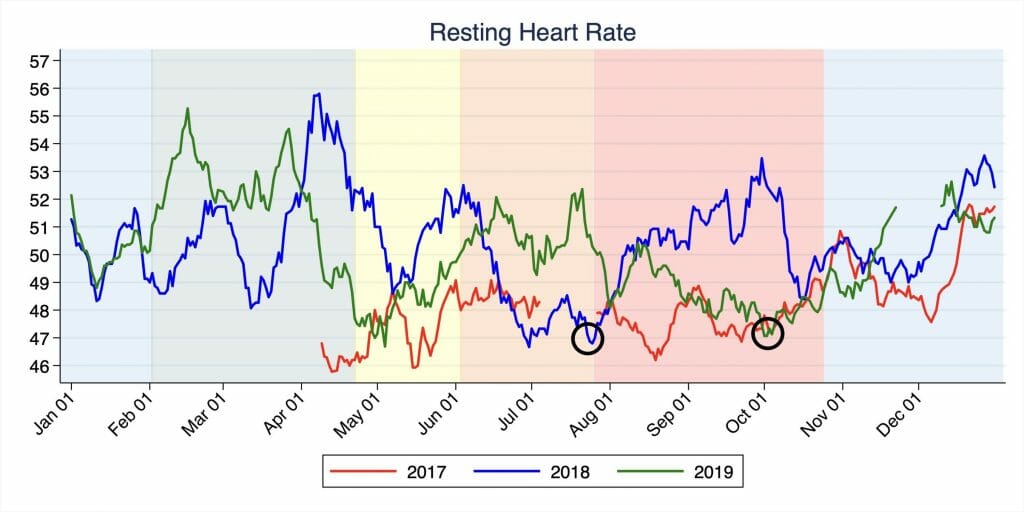
The figure above plots my average RHR across years. I’ve circled, in black, the lowest points. In 2018, it is clear that my cardio peaked at the end of July and progressively got worse until Nationals. On the contrary, after rising in the orange period in 2017 and 2019, my RHR was down until right before Nationals. After Club Nationals, you see a relative fitness decrease in December as my physical activity declines.
It’s clear to me that 2018 stood out as a bad year and 2019 was a good year. But why? One potential mechanism: my sleep quality.
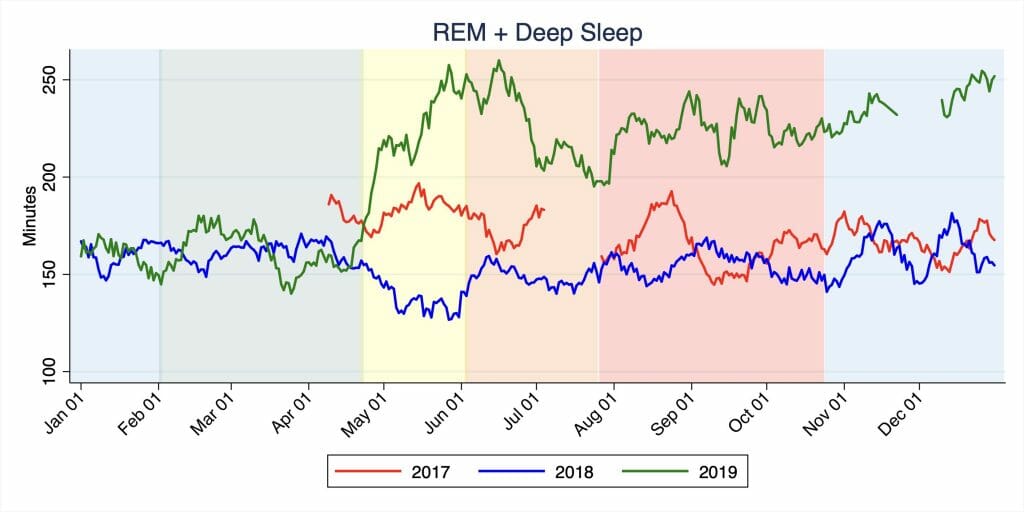
The big caveat with this figure is that my total number of sleep minutes did not change significantly across these years. The only change that occurred was the increase in the ratio of restorative sleep (REM + slow wave) to bad sleep (light sleep). I wish I can tell you why I couldn’t sleep in 2018 so that you could avoid making the same mistakes, but I just can’t figure it out.
One major difference is that, starting in 2019, I stopped waking up early to go work-out and instead took breaks during the day or after working hours to go to the gym. I don’t set alarm clocks13 if I don’t have to and allow my body to decide on its own when to wake up. Having seen the difference in the quality of my sleep between these years, I will never again sacrifice sleep for early morning activities that can be done during other times of the day.
—
Come back next week for the final installment in this series where I’ll discuss recovery and strain across different types of activities as well as some conclusions about what factors have the biggest impact on heart rate variance and, ultimately, performance.
A hallmark of true modern art, or so I’m told. ↩
Typo: when it will be taught. ↩
As an Economics Ph.D., I should know. ↩
It does make you think about why we haven’t been able to develop vaccines (malaria anyone?) this fast before. But I will save my rant about the economics of pharmaceutical development for another time. ↩
#goals ↩
See Part 1 of this column for a fuller explanation of HRV and what it indicates. ↩
Specifically, I replace the highest and lowest values in each month by the second highest and lowest, respectively. ↩
Per week, for this and all other measures in this list. ↩
Formerly Wildfire ↩
At this point, you might be wondering: hey, didn’t you pay attention to your WHOOP and take more rest days? To which I reply: apparently not. ↩
In a preliminary draft of this article, I wrote 2018: The Kurt Effect. (A joke. Haha! ↩
Again, as with HRV, relative to personal baseline. ↩
The number one reason to go to graduate school, in my humble opinion. ↩