In God we trust. Everyone else, bring data.
January 26, 2021 by Pawel Janas in Opinion
Tuesday Tips are presented by Spin Ultimate; all opinions are those of the author. Please support the brands that make Ultiworld possible and shop at Spin Ultimate! This article was submitted as part of our Tuesday Tip Jar program.
Welcome to Part 3 of my column about heart function data and performance. With the advent of new technology in wearables, it’s only a matter of time before athletes — across sports and competitive levels — try to bio-hack their way into better cardiovascular shape.
In Part 1 of this series, I argued that there are limits to what we can learn through data, but that doesn’t mean we shouldn’t track what we can and use it to inform our training and practice moving forward. In Part 2, I started a deep dive on my WHOOP data from the past four years, looking at how strain, sleep, and heart rate variance (HRV) played out over the course of an average year. In today’s article, I continue wading through the data I’ve collected and analyze strain and recovery across different types of activities. I’ll conclude with some hypotheses about what factors have the biggest impact on heart function and, ultimately, performance o the field — at least for me.
Recovery and Cardiovascular Load across Activity Type
My last article illustrated some general recovery and cardiovascular load trends within a year, with no particular focus on the multitude of activities that we, as ultimate athletes, actually do during an average 12-month span. The Club season for most teams is concentrated on one or two practices a week and four or five competitive events during the year.1 The AUDL season is compressed into 12 regular season games plus playoffs and a weekly practice. By my count, a year spent competing in both boils down to 40-50 competitive days2 spread across six months. My lukewarm take is the following: better recovery on these days leads to better results and, because there’s not that many of them, players can and should promote recovery in anticipation of these days. In this section, I stick the thermometer in this take as it relates to my own performance.
I start by first visualizing the relative strains3 of each activity — the higher the strain the more recovery is necessary, in theory.
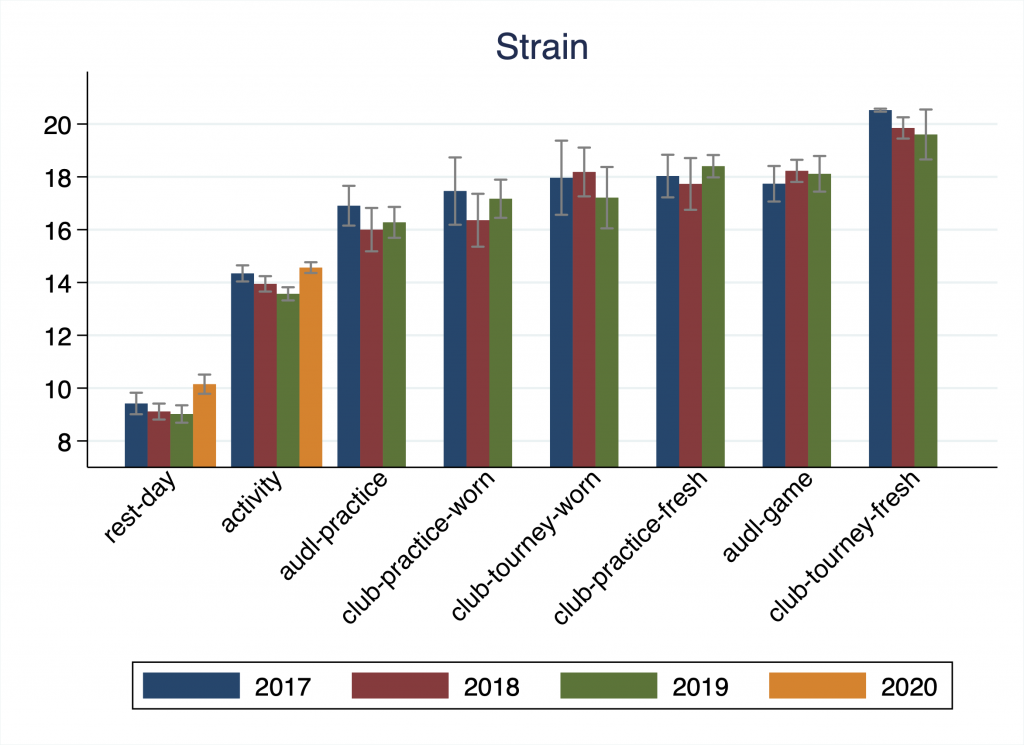
The figure above plots the average strain by eight different activity types and year: rest day, a lift/pod activity day, AUDL practice and game, Club practice on fresh (first day) and worn legs (all subsequent days), and finally a Club tournament day on fresh and worn legs. The grey bars denote 95% confidence intervals.
Clearly, the first day of a club tournament stands head and shoulders above everything else — the average strain (20+) is the highest of any single day during the year. Somewhat surprisingly, the next three ultimate related activities have similar average strains — an AUDL game seems to be roughly as strenuous as a three-hour Club practice or an elimination bracket day at a Club tournament. Another tier down, the strain of the second day of a practice weekend and a two-hour AUDL practice are roughly similar; in-week pod and lifting activities are another drop down on the strain scale. Rest days are, well, rest days.
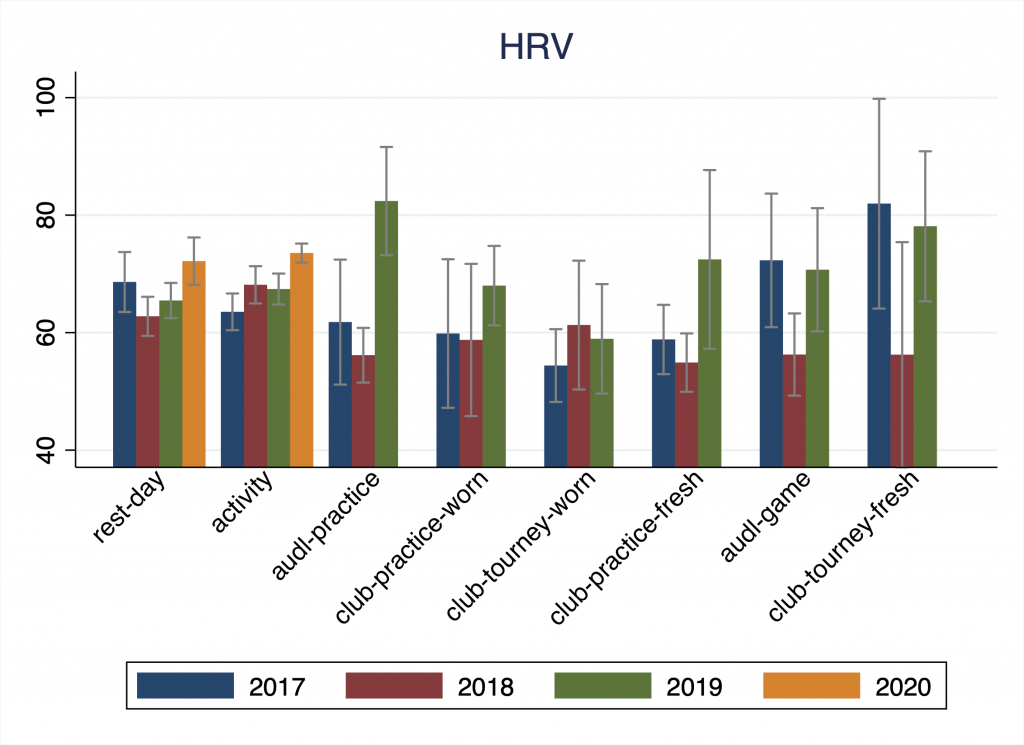
So what was my HRV before each of these activities and did I improve from year to year? One way of answering this question is comparing my average HRV on rest and “activity” days to competition days.
In 2017, it is clear that I did have higher HRVs for AUDL games and Club tournaments4 but was woefully dogging it in practices. In 2018, my lift and pod days were my prime HRV days — yikes! In 2019, things turned around and I was rocking practice recovery above baseline. My recovery for rest and “activity” days in the 2020 offseason was trending upwards, a truly meaningless but personally sad note in the requiem of 2020.
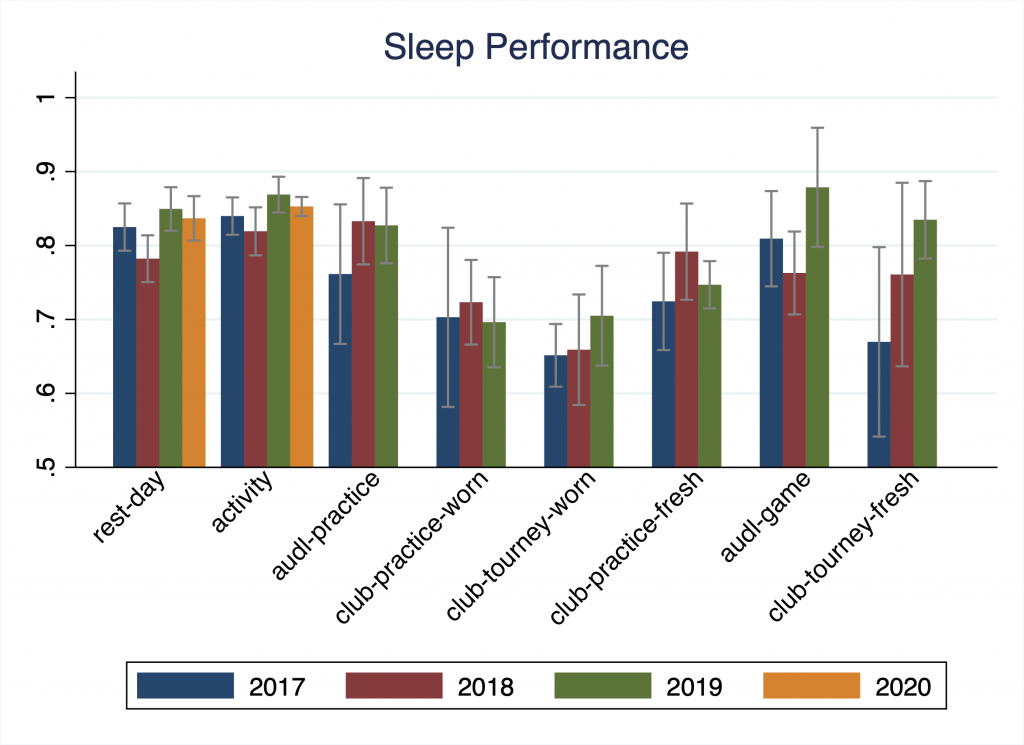
In general, I think I was doing OK on the “recovery-for-activity” front, but there is certainly room for improvement. One clear indicator of better intentional action on my part comes, again, in my sleep performance. For rest and activity days, my sleep performance is commendable — I slept between 80 and 85 percent of the recommended amount, good enough to pass the first year of grad school. What really stands out — for me at least — is, in general, improvement in sleep at tournaments and before AUDL games from 2017 to 2019.
BONUS: Is every game created equal?
Long story short: no. Let’s dig a little deeper on these strains.
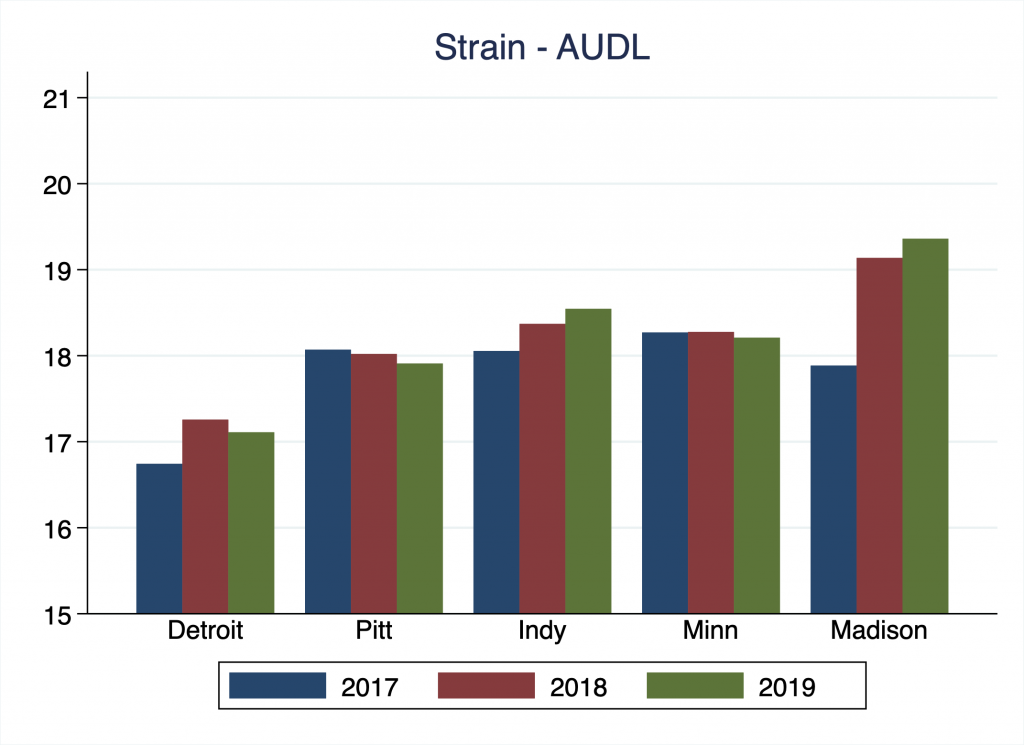
This is prime bulletin board material for the other AUDL teams in the Central Division so I won’t get into it. I am certain, Reader, that you can make your own inferences on the figure above.
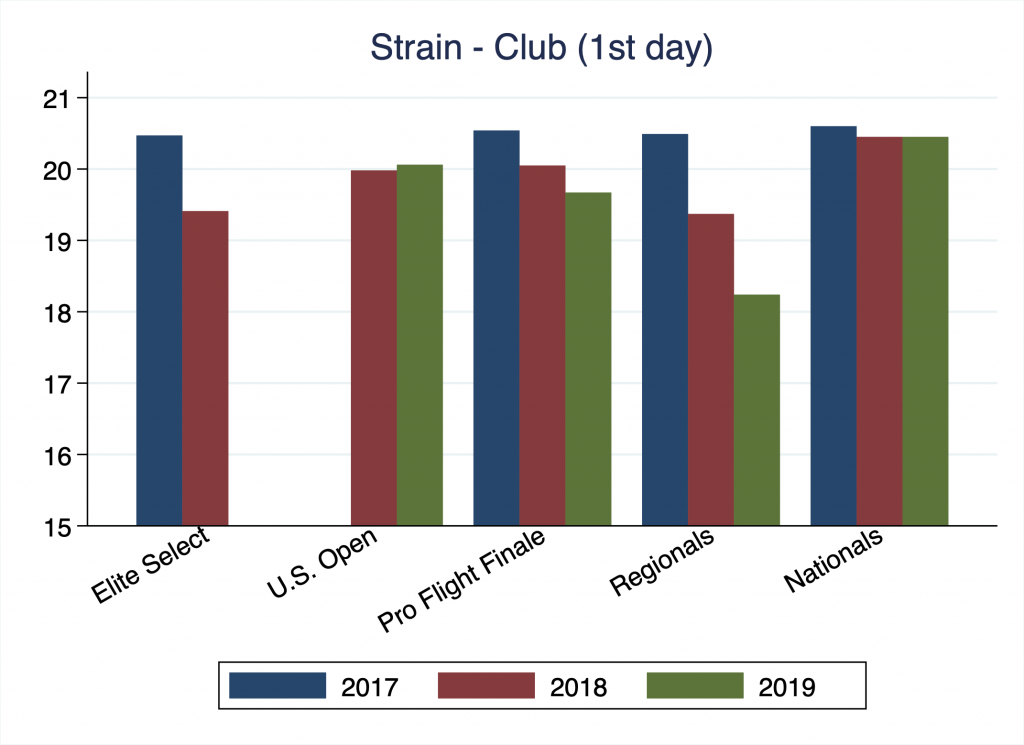
As to the Club data, what is there to say? If you consider strain a proxy for effort,5 it is clear that the Great Lakes region has become less competitive over the years. Instead of writing a Great Lakes Regionals recap, Ultiworld might as well just ask for my strain scores. Other than that, Nationals is Nationals — always brutally hard.
Bonus segment over.
Recovery, Strain, and Performance Using AUDL Statistics6
I have said nothing about actual performance as it relates to recovery because I don’t have any good measures of performance.7 What I do have, instead, are AUDL statistics. So, let’s take a detour into game stats and see if the recovery/strain paradigm is actually predictive for these rudimentary performance measures.
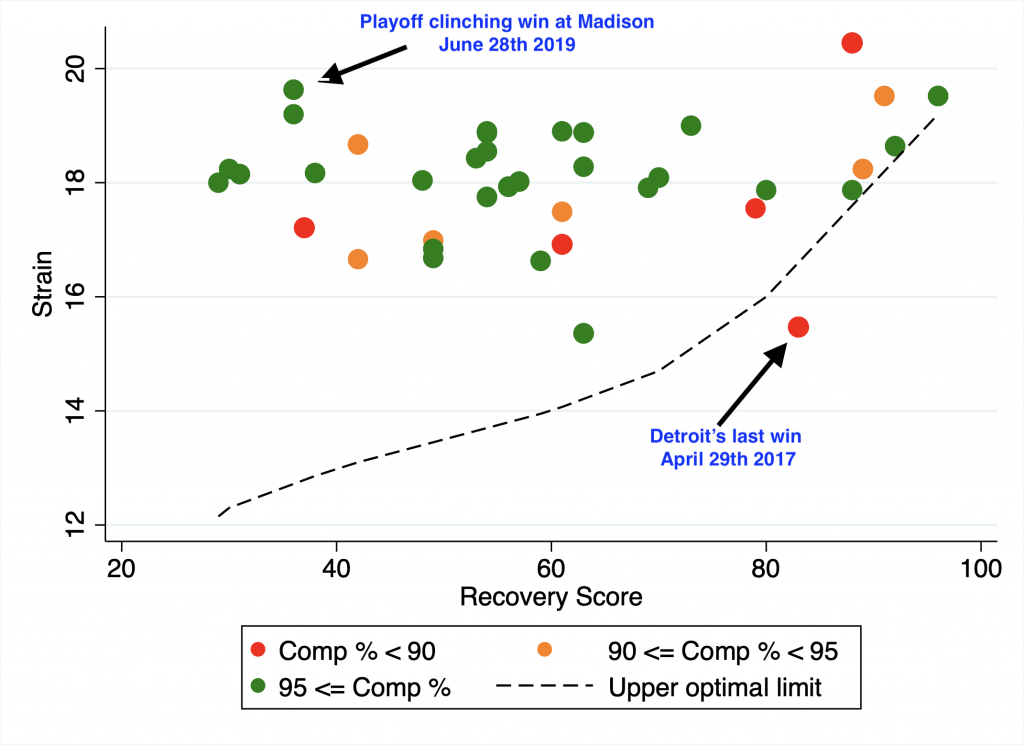
The figure above plots my completion percentage (color) on the recovery score and strain axes. The dashed line is the recommended upper limit of strain based on my actual recovery score — a score from 0 to 100, largely based on HRV. Going from left to right and holding everything else constant,8 you may expect to find more high completion percentage “green” games. Said another way, moving farther away from the dashed line into the upper left corner means more overreaching and potentially more mistakes due to fatigue. What you see, in fact, is the opposite. Some of my worst games, according to these statistics, have come when I was 80%+ or more recovered! The Detroit Mechanix’s last win is the frontrunner in the line of games I will erase from my memory once Elon Musk invents memory manipulation while Chicago’s win at Madison to (effectively) seal a playoff spot in 2019 happened on one of my least recovered days.
Predicting HRV: A Voodoo Mama Juju Approach9
We’ve arrived at our final destination and God bless you for still reading. As all writers are taught, save the best for last. I was never taught writing so this section is not the best. Au contraire, it’s Voodoo Mama Juju.
The preceding sections of this piece were descriptive: what were my trends in recovery and cardiovascular strain across years and activities. This section is prescriptive: what is the relationship between HRV and the variables that I can control, such as my sleep patterns and training? Although the main stories of the above sections — sleep good, overtraining bad — will surely pop out here, it’s darn nice to get a cold hard estimate of how important these factors actually are.
I estimate a linear model10 of HRV and RHR (three-day averages) on seven-day averages of sleep, strain/overreach, and whether or not I slept at home or not. Effectively, using my dataset of over 1,300 observations, I’m calculating the correlation between *stuff* in days 0 through 7 on HRV and RHR on days 8 through 10. This is what the estimates look like:
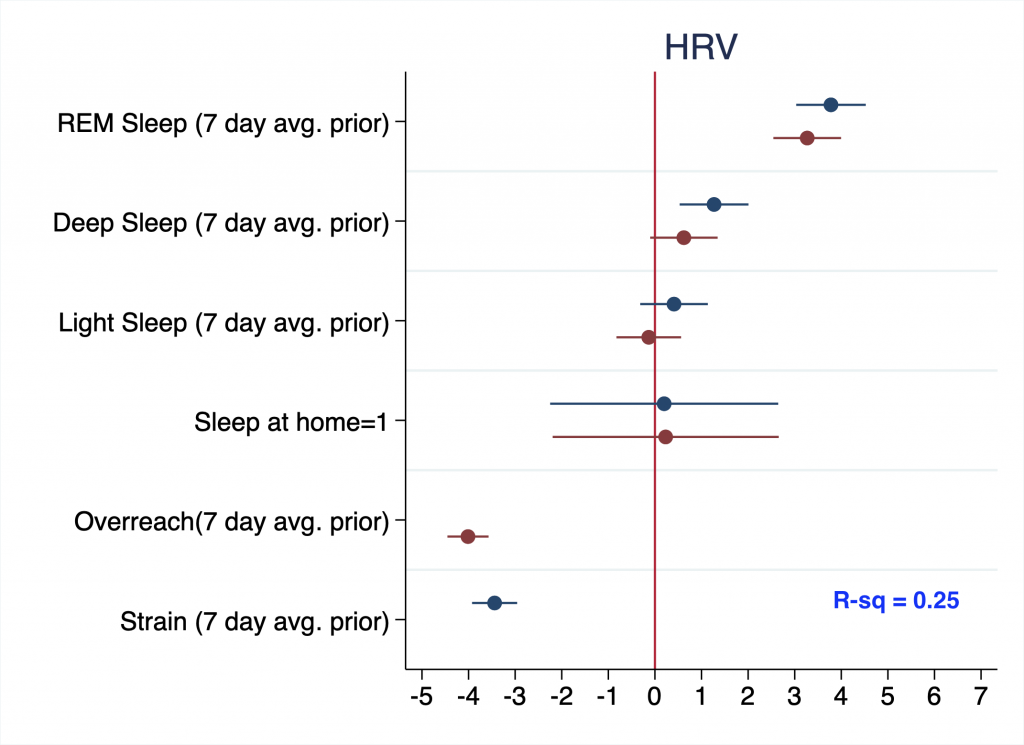
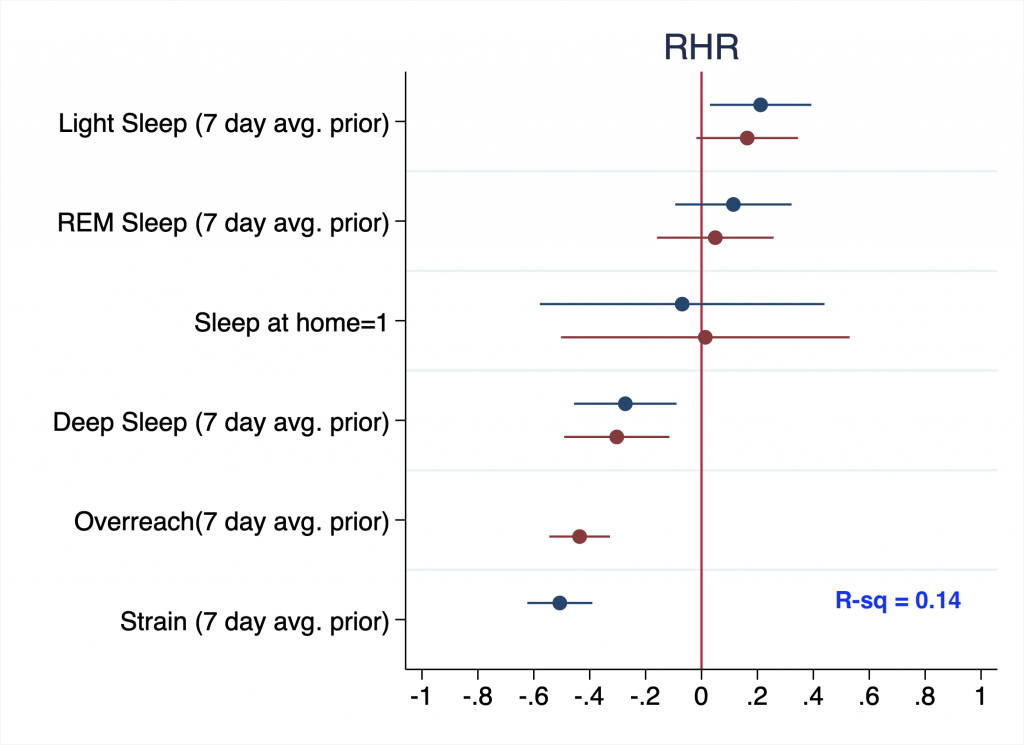
The dots on the figures above show the partial correlations between one standard deviation in variable on the y-axis and the level change in HRV on the x-axis. For example, this analysis reveals that a 26-minute increase (one standard deviation) in REM sleep has historically correlated with between 4 and 5 points higher HRV. Likewise, overtraining by 1.6 WHOOP points (one standard deviation) typically correlated with a 3 or 4 HRV point decrease. The dots in red correspond to model results when overreach (strain minus optimal strain) is used while the blue dots represent the model estimates when just strain is used. All variables were detrended based on annual averages and the bands around the estimates are 95% confidence intervals.
So what seems to be driving the fluctuation in HRV and RHR (resting heart rate)? For HRV, the single largest factor is overtraining: training more than what your body is ready for is the best single predictor of an HRV decrease. On the other hand, getting longer quality sleep (but not light sleep) will help. That said, you need to train (but not necessarily over-train) in order to decrease RHR. And that, my friends, is total Voodoo Mama Juju.
Concluding Remarks
Given the evidence presented above, I think my story is boring, predictable, and substantiated by some vestige of empirical evidence: one year removed from college and still in the “grind” at all costs mentally, I worked my way out of shape in 2017 and was totally unprepared for the demands of playing both AUDL and Club. I was simply not giving my body enough time to recover and the strain was too high. In 2018, I could not sleep and my recovery was in the dumpster for a prolonged period of time — a trend that I should have caught using my WHOOP but inexplicably didn’t. At some point along the way, I learned how to optimize (and sleep!) and 2019 turned out to be a relatively good year with high average recovery as well as mini recovery peaks before major competitions. Though the strain of each type of activity has remained roughly constant throughout, my preparedness was better in 2019, as indicated by HRV and sleep. I can pat11 myself on the back for the improvement and hope for an even better 2021.
Thanks for reading. If you have comments or questions, or if you’re actually a bio-statistician and want to scream at my amateurism, please reach out! You can find me on the bird app (@secondarypotato) and email ([email protected]).
Anything goes for college teams. ↩
Kids, practice is competitive on good teams. If it’s not, you’re on a bad team. Play on a good team. ↩
See a fuller explanation of WHOOP’s Strain measure in the Caveats and Measurements section near the top of Part 2 of this series. ↩
At least to start the weekend. ↩
For an O-line handler, strain will effectively correlate to the amount of time the offense has to play defense after a turn, and hence strain and relative strength of a team’s O-line are inversely proportional. ↩
t’es l’amour de ma vie! ↩
Yet. Stay tuned for a 2021 update. ↩
A big time lol. ↩
This is a reference to a stupid game played by the characters in The Office to make themselves feel better after they find out Dunder Mifflin is going bankrupt. The relevance of this reference should be clear. ↩
I run an ordinary least squares regression, standard errors are robust to heteroskedasticity. ↩
Pat? ↩